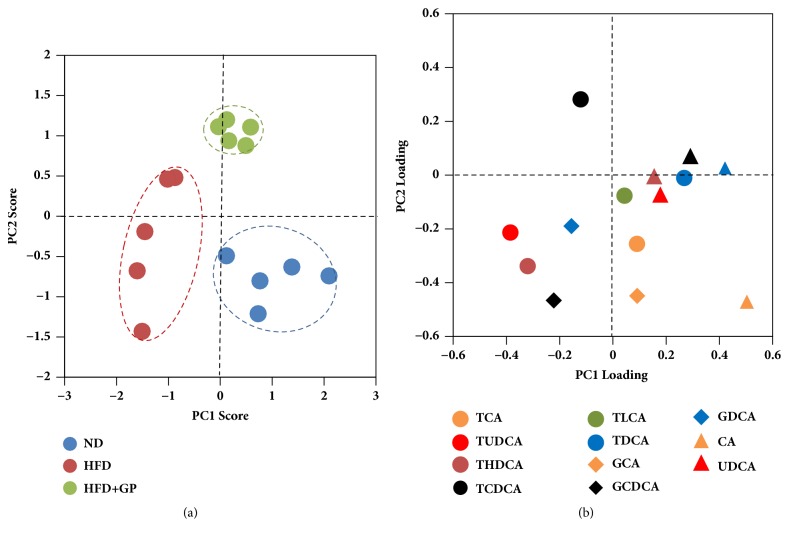
Figure 6.
Gypenosides changed the global profile of mouse hepatic bile acids pool. (a) Score plots of principle component analysis on bile acids profiles. Each spot represents a mouse sample. Gypenosides made the location of mice shift away high fat diet group. ND: normal diet group; HFD: high fat diet group; HFD+GP: gypenosides treatment on mice fed with high fat diet; (b) loading plots of principle component analysis. Each spot represents a bile acid. Location of bile acids on loading plots represents its contribution on components.

