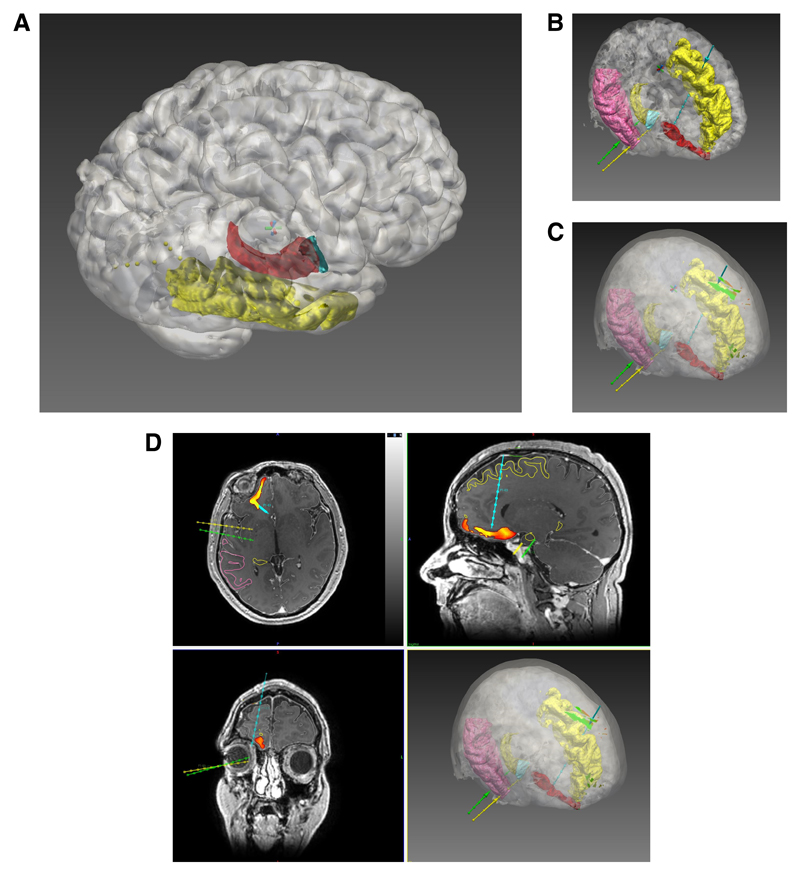
Figure 1. Computer-assisted planning.
Computer-assisted electrode generation workflow. A) Using the EpiNav Strategy™ module ROIs are automatically segmented from the parcellation image. In this example the cortex (white) is semi-transparent to allow visualisation of the underlying middle temporal gyrus (yellow), amygdala (blue) and hippocampus (red). B) Entry points and target points for the electrodes within the strategy are generated automatically based on the safety metrics defined by the user. Please note, in figures 1 B-D only three electrode trajectories are shown for clarity. Electrode colours are shown as right amygdala (yellow), right anterior hippocampus (green) and right posterior mesial orbitofrontal (blue). C) A surface risk ‘heat map’ on the scalp has been generated for the mesial orbitofrontal electrode, as an example, showing safety of potential trajectory entry points. D) Orthogonal and 3D views showing the target risk ‘heat map’ has been generated for the mesial orbitofrontal electrode, as an example, showing safe trajectory target points in orthogonal planes. Please note, in figures 1 B-D only three electrodes (right amygdala (yellow), right anterior hippocampus (green) and right posterior mesial orbitofrontal (blue)) are shown for clarity. A probe’s eye view (not shown) can then be linked to the orthogonal planes to assess the electrode trajectory further.

