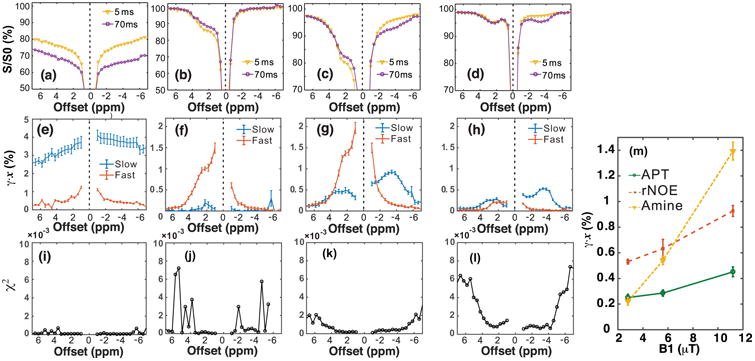
Figure 2.

VDMP-CEST Z-spectra at mixing times of 5 ms and 70 ms for hair conditioner (a, e), glutamate (Glu) with peak saturation power 11.8 μT (b, f), BSA solution with peak saturation power 11.8 μT (c, g) and BSA solution with peak saturation power 2.9 μT (d, h). (e-h) The transfer spectra of the corresponding slow-(γ̄slowxslow) and fast-transferring (γ̄fastxfast) components obtained by fitting the VDMP build-up curves at different offsets for the phantoms in (a-d). (i-l) The chi-square goodness-of-fit test for each offset are plotted. (m) The APT, rNOE, and amine CEST signal of BSA solution obtained by fitting the VDMP build-up curves using a three-pool model as a function of peak saturation power. The error estimations were carried out by fitting the data pixel-by-pixel, and then calculating its average value and standard variation. The VDMP sequence consisted of 16 pulses of 10 ms length.
