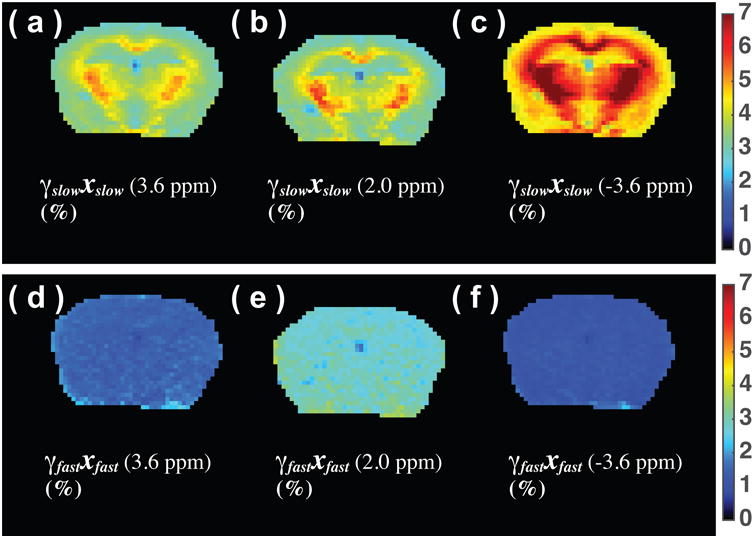
Figure 4.

Slow-transfer component map (γ̄slowxslow) of a mouse brain at 3.6 ppm (a), 2 ppm (b) and -3.6 ppm offsets (c), as well as the fast-transfer proton (FP) images (γ̄fastxfast) at frequency offsets of 3.6 ppm (d), 2 ppm (e), and -3.6 ppm (f). The images were recorded using 16 Gaussian pulses (10 ms pulse width) with peak saturation power 11.8 μT.
