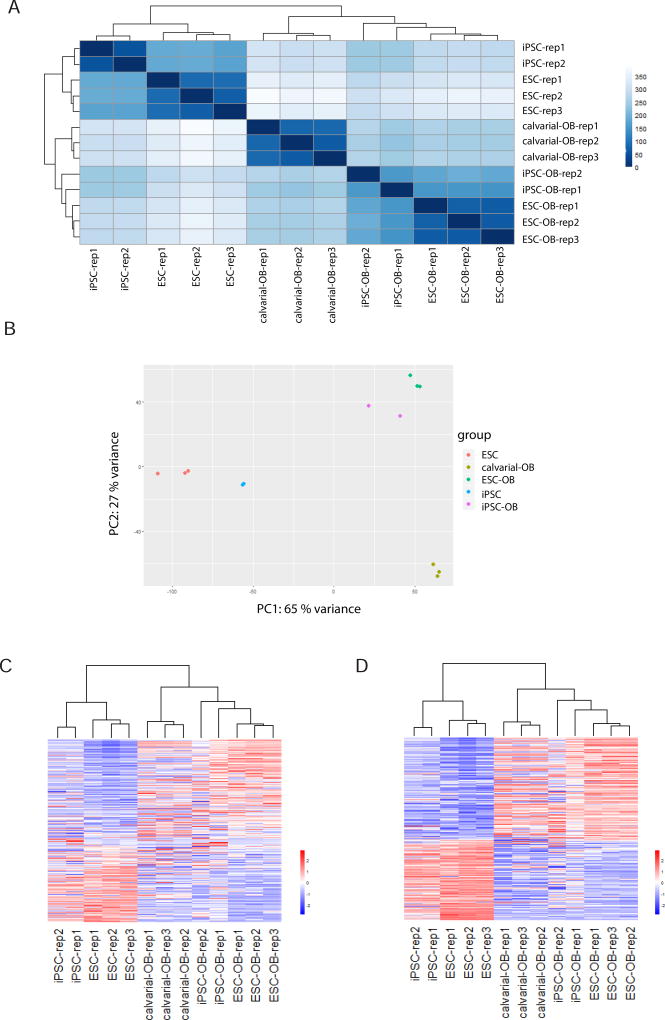
Fig. 6. ESC-OB and iPSC-OB resemble calvarial-OB.
(A) Heatmap of sample-to-sample distances using rlog-transformed values of RNA-seq data. For each sample, the distance calculation is based on the contribution of rlog from all the genes. (B) PCA plot using the rlog-transformed values of RNA-seq data. Each color represents a sample type. Each sample has three or two replicates. (C) Heatmap of relative rlog-transformed values of total genes across samples. Each row represents a gene. Each column represents a cell type. (D) Heatmap of relative rlog-transformed values of differentially expressed genes in ESC-OB versus ESC across samples. Each row represents a gene. Each column represents a cell type.

