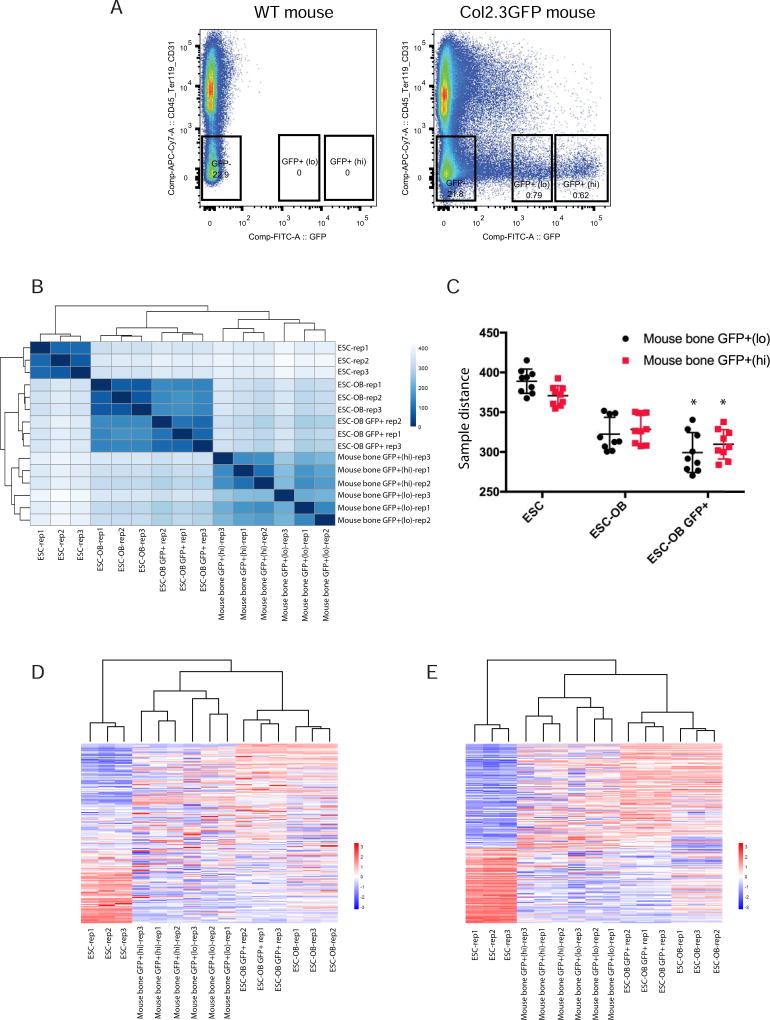
Fig. 8. ESC-OB GFP+ population resembles mouse bone GFP+ population.
(A) FACS sorting of CD45−/Ter119−/CD31−/GFP+(lo), CD45−/Ter119−/CD31−/GFP+(hi), and CD45−/Ter119−/CD31−/GFP− cells from mouse long bone. Three biological replicates were processed. Long bone cells from WT mice were used as sorting gate negative control. (B) Heatmap of sample-to-sample distances using rlog-transformed values of RNA-seq data. (C) The sample distance between ESC, ESC-OB, ESC-OB GFP+ with mouse bone GFP+(lo) and GFP+(hi) populations. *, p<.05 (relative to ESC-OB). (D) Heatmap of relative rlog-transformed values of total genes across samples. Each row represents a gene. Each column represents a cell type. (E) Heatmap of relative rlog-transformed values of differentially expressed genes in ESC-OB GFP+ versus ESC across samples. Each row represents a gene. Each column represents a cell type.

