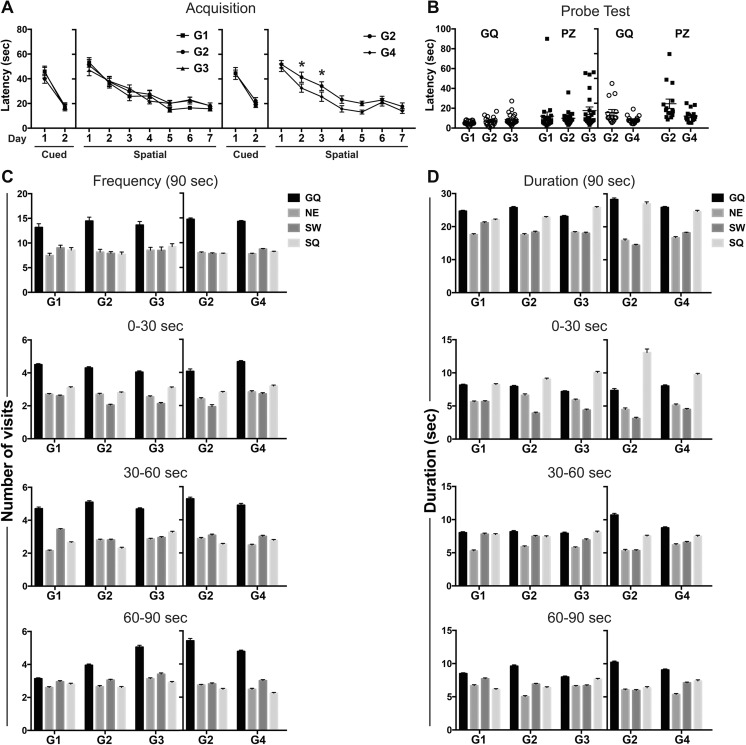
Fig. 4.
Morris water maze performance in adult Long-Evans hooded male rats. (a) Cued learning across 2 days and spatial training across 7 days. Data expressed as mean latency ± SEM (over three trials per day) to escape onto platform in the goal quadrant (GQ). A significant decrease in latency was observed over training (G1 vs. G2: F(6,228) = 26.28; p < 0.0001; G2 vs. G3: F(6,240) = 20.81; p < 0.0001; G2 vs. G4: F(6,180) = 32.07; p < 0.0001). *significantly different (p < 0.01) as compared to G2. (b) Probe trial initial latencies to enter GQ or platform zone (PZ). (c–d) Probe trial distribution to quadrants across 90- and 30-s epochs for (c) # of visits and (d) duration of time in each quadrant. Data represents mean ± SEM and individual animal responses. G1: standard chow/ RO-H2O (n = 20); G2: low-F− chow/RO-H2O (n = 20); G3: low-F− chow/10 ppm F− drinking water (n = 22) and G2 (n = 15) and G4: low-F− chow/20 ppm F− drinking water (n = 17). Drinking water exposure began on gestational day 6. Distinctions of the individual quadrants: GQ: Northwest goal quadrant; NE, Northeast; SW, Southwest; SQ, Southeast start quadrant

