Fig. 6.

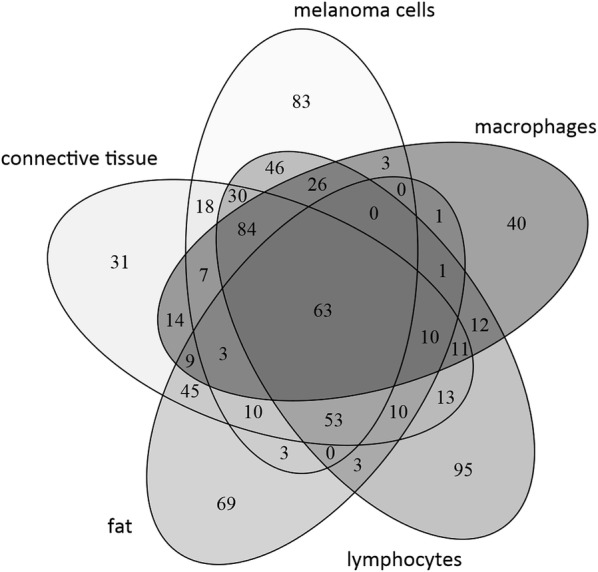
Venn diagram showing the distribution of the detected endogenous signals present in the different regions of the MALDI images from melanoma tissue samples isolated after surgery

Venn diagram showing the distribution of the detected endogenous signals present in the different regions of the MALDI images from melanoma tissue samples isolated after surgery