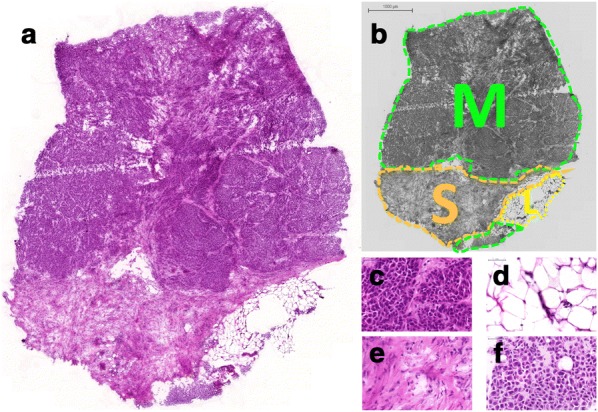
Fig. 7.

Histological images of a tissue sample displaying: a overview with low magnification (1×, HE stain), b an annotated area (M: tumour, S: connective tissue, L: fat tissue), c–f high magnification images of the resultant regions representing (c) melanoma from upper region, d fat tissue, e connective tissue, f melanocytes from lower region (53×, HE stains)
