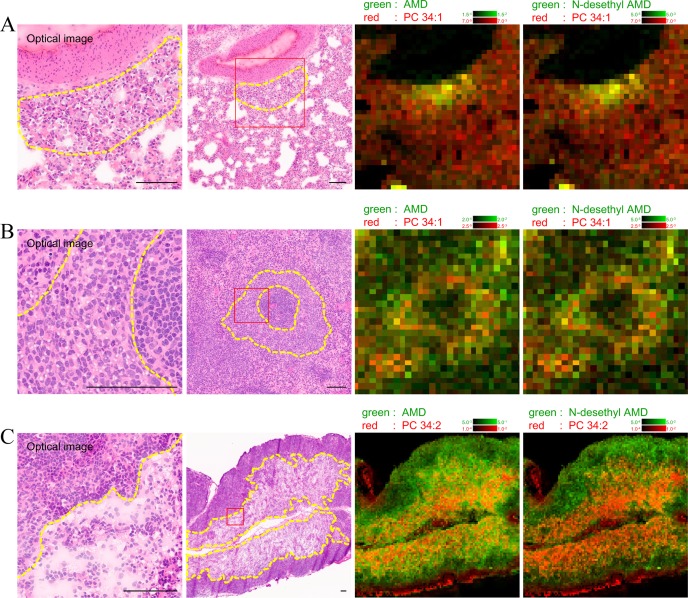
Fig. 2.
Comparison between light microscopy and IMS analysis in the lung (A), spleen (B), and mesenteric lymph node (C) of AMD-administered rat. The images are taken from the same lesion area. The left optical images are magnified images of the right optical images (red lined square). The detection intensity of AMD, N-desethyl AMD, and representative PCs (PC 34:2 and 34:1) was relatively higher in the lesion areas where foamy macrophages and/or vacuolated lymphocytes accumulated (yellow dotted outline) compared with normal areas. Optical image (HE staining) and IMS image. Scale bar = 100 μm.

