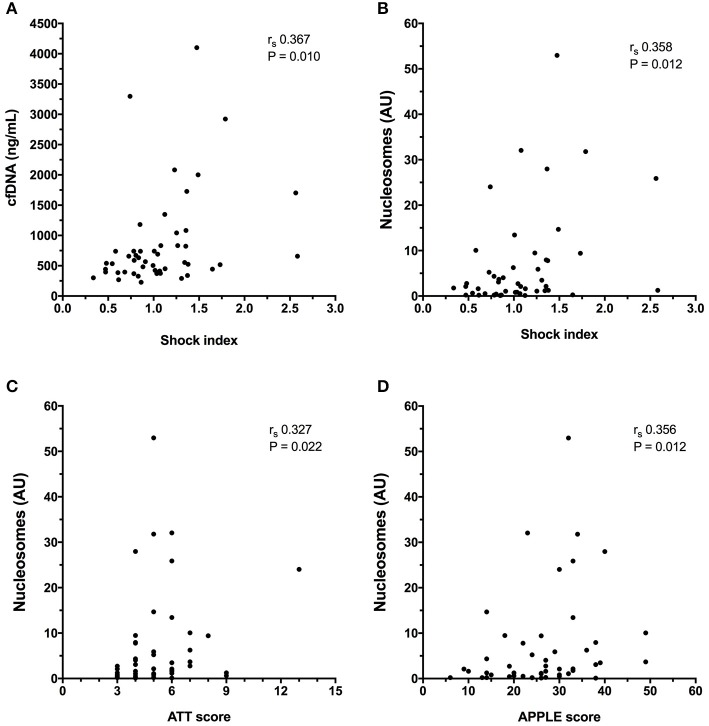
Figure 4.
X-Y scatterplots of illness severity scores vs. biomarker concentrations. (A) Shock index vs. plasma cell-free DNA (cfDNA) concentration, (B) Shock index vs. plasma nucleosome concentration in arbitrary units (AU), (C) Animal Trauma Triage (ATT) score vs. plasma nucleosome concentration (D) Acute Patient Physiology and Laboratory Evaluation (APPLE) score vs. plasma nucleosome concentration. Spearman's correlation coefficients (rs) with associated P-values are displayed in each panel. P < 0.05 was considered significant.

