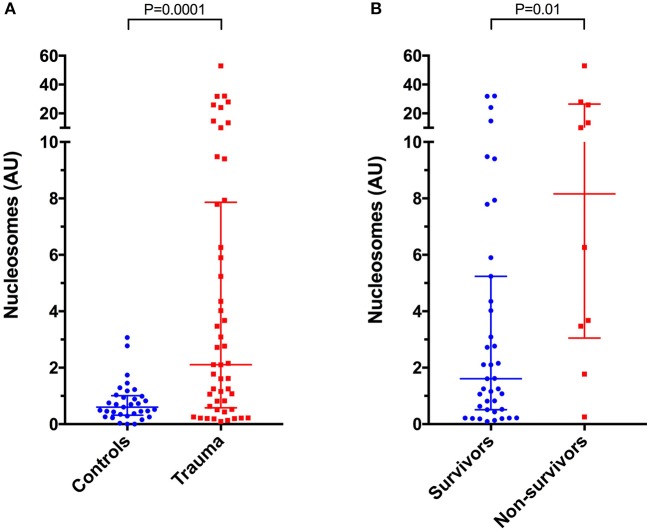
Figure 5.
Scatterplots of plasma nucleosome concentrations in arbitrary units (AU) in (A) healthy controls (n = 33) compared to dogs following moderate-severe trauma (n = 49), and in (B) survivors (n = 39) compared to non-survivors (n = 10). The central horizontal line represents the median, and the two error bars represent the interquartile range. Comparisons between the groups were performed using the Mann-Whitney U test. P < 0.05 was considered significant.

