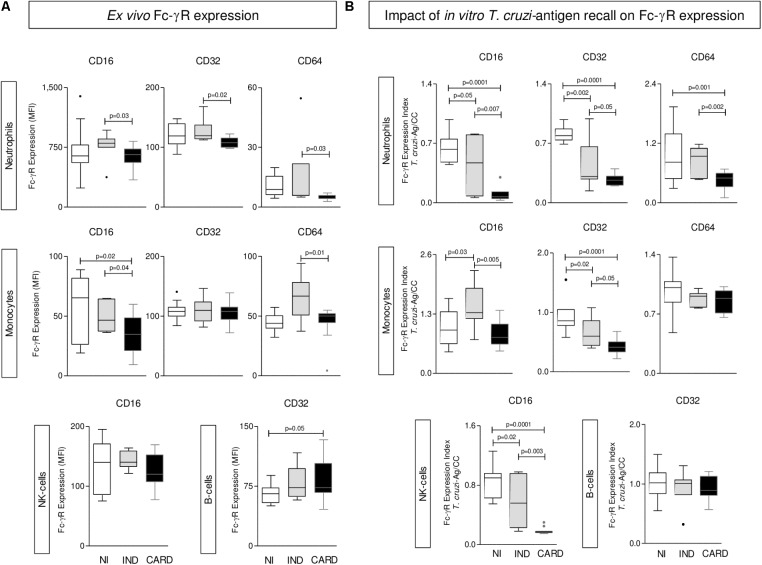
FIGURE 1.
Expression of Fc-γR by phagocytes, NK-cells, and B-lymphocytes. The analysis of Fc-γR expression by neutrophils, monocytes, NK-cells, and B-cells were performed in whole blood samples collected from indeterminate (IND,  = 8) and cardiac (CARD,
  = 13) Chagas disease patients and non-infected subjects (NI,
  = 11). The profile of CD16, CD32, and CD64 was characterized at ex vivo
(A) and upon Trypanosoma cruzi-antigen recall in vitro
(B). Data are displayed in box plot format (median with minimum and maximum values) as mean fluorescence intensity (MFI) for each Fc-γR. Significant differences at p < 0.05 are underscored by connecting lines and p-values provided in the figure.

