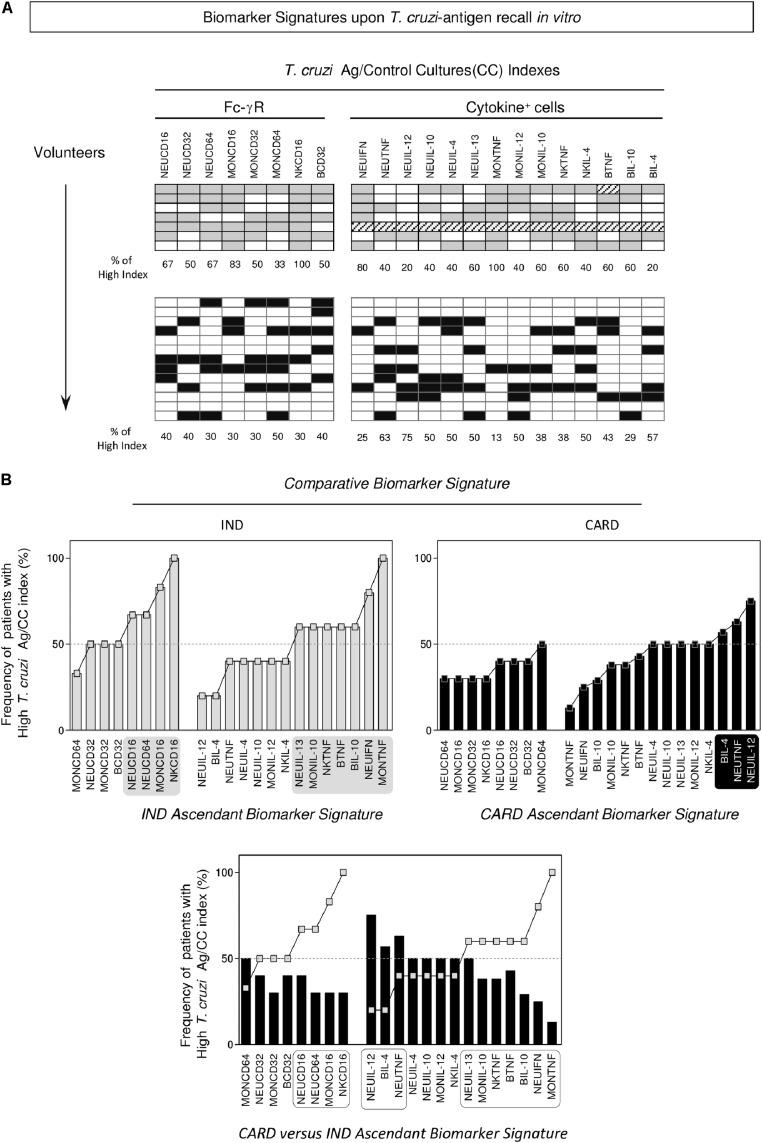
FIGURE 3.
Biomarker signatures upon T. cruzi-antigen recall in vitro.
(A) Gray-shaded diagrams were constructed to compile the proportion of volunteers presenting (T. cruzi-antigen/Control Culture) index above the global median cut-off established for the study population. Twenty-two attributes (Fc-γR and Cytokine+ cells) were assessed and the percentage of volunteers with a high index determined for indeterminate (IND,  = 7) and cardiac (CARD,
  = 13) Chagas disease patients. (B) The biomarker signatures were assembled as an ascendant curve for each clinical group to identify the relevant attributes as those with frequency above the 50th percentile (gray-shaded background). The biomarker signature of CARD was further overlaid with the IND-ascendant signature for comparative analysis. Differences were considered for attributes with frequencies confined into distinct 50th percentiles (dashed-rectangles).

