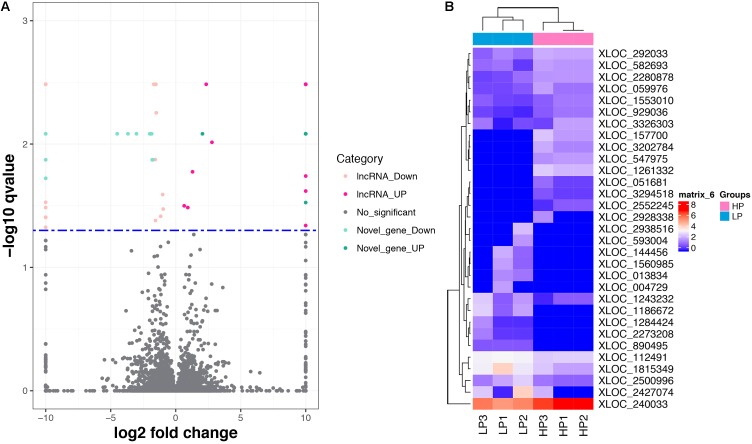
FIGURE 3.
The differentially expressed lncRNAs and mRNAs. (A) Volcano plot displaying differentially expressed lncRNAs and mRNAs within two different comparison groups. The red and orange dots represent the differentially expressed lncRNAs (q < 0.05); the light blue and blue dots represent the differential expressed mRNAs (q < 0.05); the gray dots represent transcripts whose expression levels did not reach statistical significance (q > 0.05). (B) Cluster analysis of differentially expressed lncRNAs.

