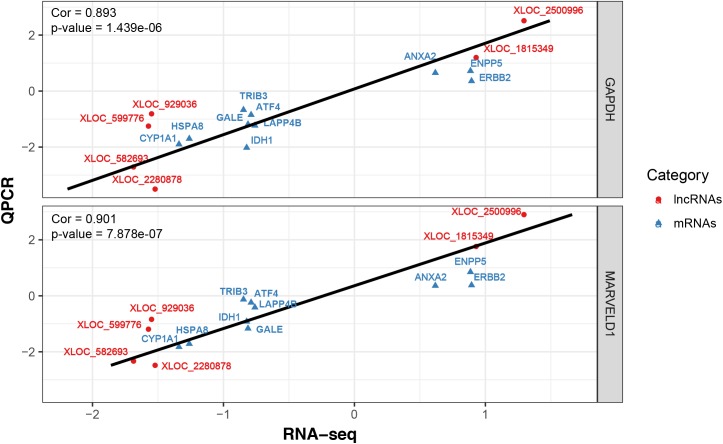
FIGURE 4.
Correlations of gene expression level of 10 differentially expressed genes and 6 lncRNAs between high and low milk protein percentage using RNA-Seq and qRT-PCR. The x- and y-axis show the log2 (ratio of mRNA levels) measured by RNA-seq and qRT-PCR, respectively. GAPDH and MARVELD1 gene were used as housekeeping internal control. The red and blue dots represent the differentially expressed genes and lncRNAs, respectively.

