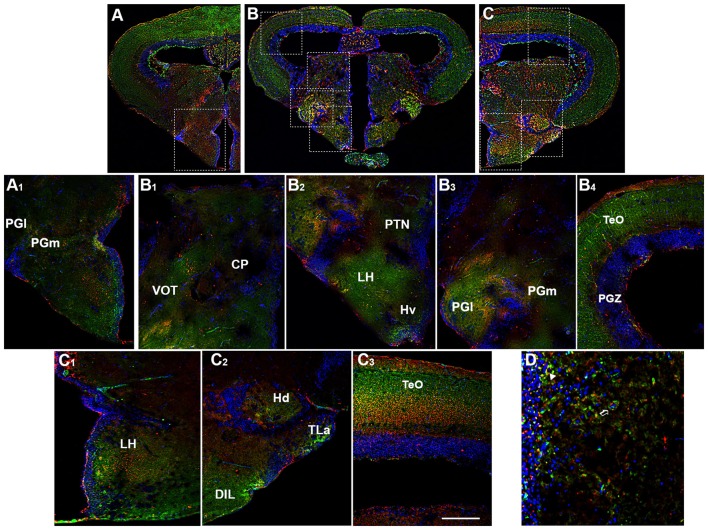
Figure 4.
Distribution of OX-2R (red) and CB1R (green), and their co-localization OX-2R/CB1R (yellow) in coronal sections of the diencephalon/midbrain. (A–C) OX-2R/CB1R co-expression has been observed in the lateral (PGl) and medial (PGm) preglomerular nuclei, VOT, central posterior thalamic nucleus (CP), posterior tuberal nucleus (PTN), lateral hypothalamus (LH), ventral zone of the periventricular hypothalamus (Hv), periventricular gray zone of the optic tectum (PGZ), optic tectum (TeO), dorsal zone (Hd) of the periventricular hypothalamus, torus lateralis (Tla), diffuse nucleus of inferior lobe (DIL). (A1) Higher magnification of the field boxed in (A) showing the OX-2R/CB1R co-expression within the PGl and PGm. (B1–B4) Higher magnification of the fields boxed in (B) showing the OX-2R/CB1R co-expression within the CP and VOT (B1), PTN, LH and Hv (B2), PGl and PGm (B3), TeO and PGZ (B4). (C1–C3) Higher magnification of the fields boxed in (C) showing the OX-2R/CB1R co-expression within the LH (C1), Hd, Tla and DIL (C2), TeO (C3). (D) Detail of OX-2R/CB1R co-expression in LH: arrow showing a putative adjacent localization of OX-2R/CB1R and arrowhead showing a putative co-localization and overlapping of OX-2R/CB1R in the same cells. DAPI (Blue) was used as a counterstaining to show nuclei. Scale bar, 250 μm for (A–C); 50 μm for (A1,B1–B4,C1–C3); 25 μm for (D).

