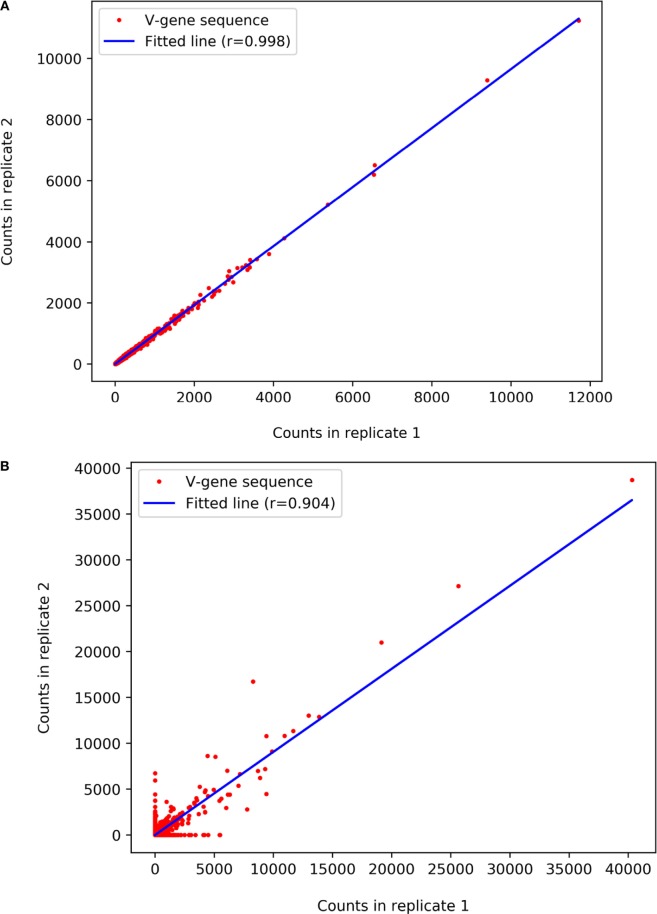
Figure 10.
Pearson correlation between two next-generation sequencing replicates. Each dot represents a unique amino acid variable region. The X and Y axes indicate the number of times each such read appears in the first and the second replicate, respectively. (A) Replicates with high reproducibility and (B) with lower reproducibility between replicates.

