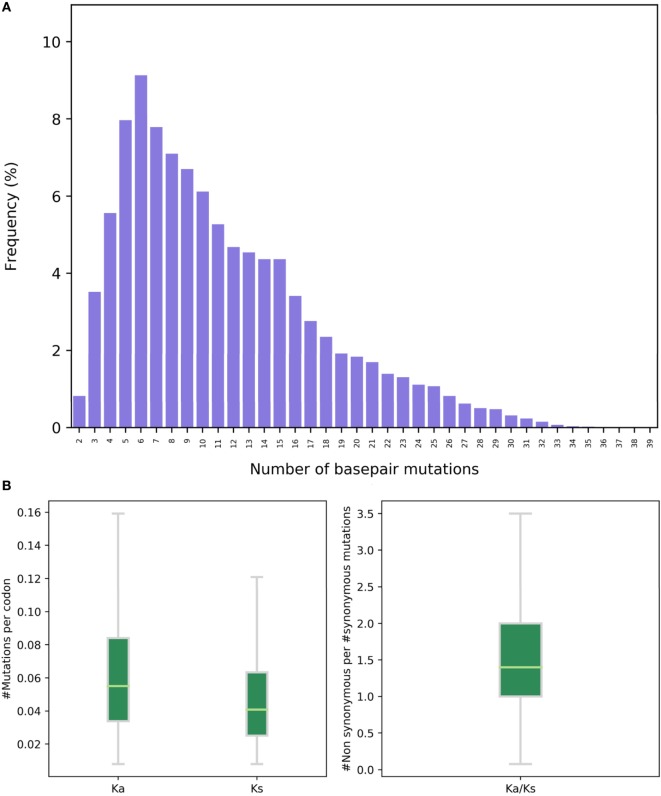
Figure 4.
Somatic hypermutation analysis. (A) A histogram showing the frequency of the number of base pair mutations in a next-generation sequencing replicate. The X axis represents the number of mutations (both synonymous and non-synonymous) defined by comparison to the germline genes. (B) The number of non-synonymous (Ka) and synonymous (Ks) mutations and their ratios (Ka/Ks), based on comparison to the germline genes. The Y axis is the number of mutations per codon. Each dot represents a unique variable region nucleotide sequence.

