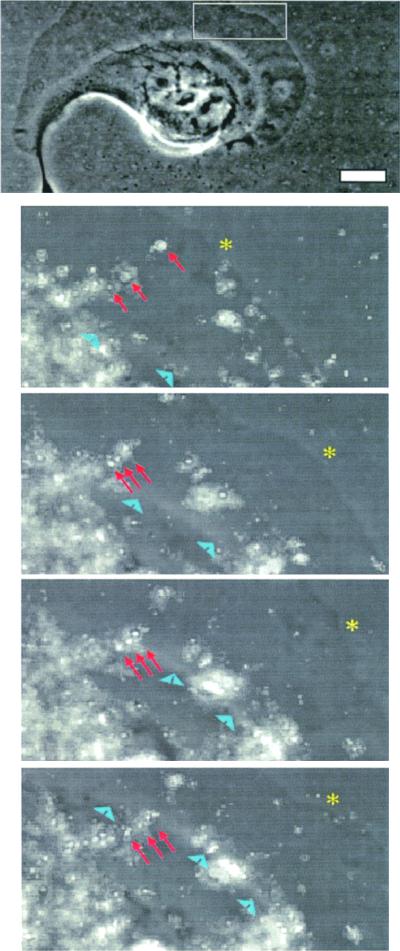
Figure 8.
Matrigel compression ends at the base of lamellae. Clone A cells were stimulated with PMA (25 ng/ml) and analyzed using time-lapse video microscopy. Both phase contrast and fluorescent images were taken at 2-min intervals and merged digitally. Top panel shows a phase contrast image of the cell and bottom panels show a magnified frame sequence of the region specified by the rectangle in the top panel. The frame sequence shows the compression of a group of beads (arrows) until the base of the lamellae (arrowheads) passes over them, a time at which the beads partially relax (bottom). This observation was commonly seen for other beads undergoing compression beneath the lamella. Asterisk denotes the leading edge. Bar, 10 μm.

