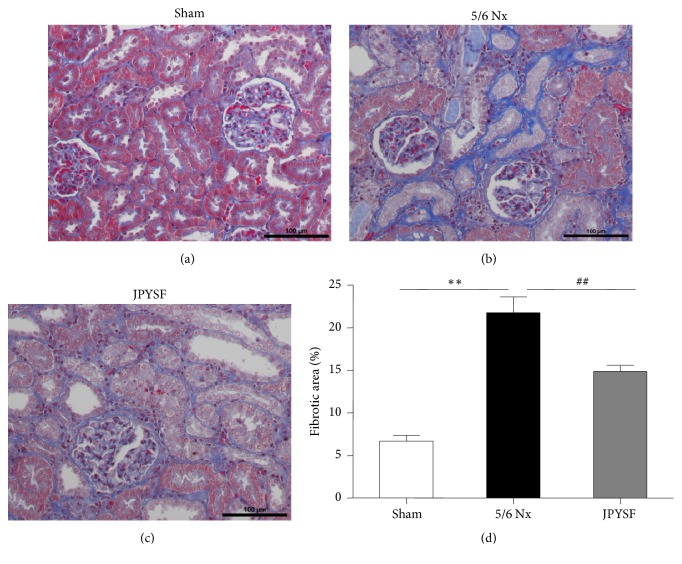
Figure 3.
JPYSF ameliorated interstitial fibrosis in 5/6 Nx rats. Masson staining showing representative image of renal tissue from the sham group (a), the 5/6 Nx group (b), and the JPYSF group (c). All images are shown at identical magnification, ×200. (d) Quantitative analysis of fibrotic area. Data are presented as the means ± SEM, n=6 rats per group (∗∗P<0.01 compared with the sham group; ##P<0.01 compared with the 5/6 Nx group).

