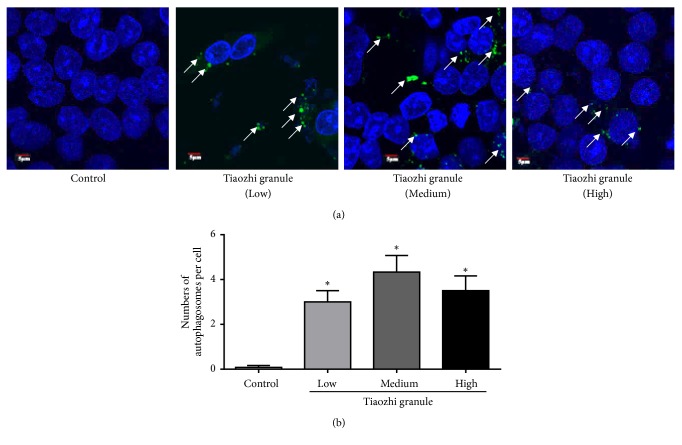
Figure 3.
Immunofluorescent analysis of Tiaozhi granule on the formation of autophagosomes. (a) Representative images of immunofluorescent detection of LC3-II. Nucleus was stained with DAPI in blue color. Autophagosomes were observed with LC3-II protein expression. Green dots in the cell cytosol indicate autophagosomes (marked with white arrows). Magnification of the image is 400X. (b) Numbers of autophagosomes in HUVECs within each treatment group were counted. Data are presented as mean ± SEM (n = 8). ∗p <0.05 versus control.

