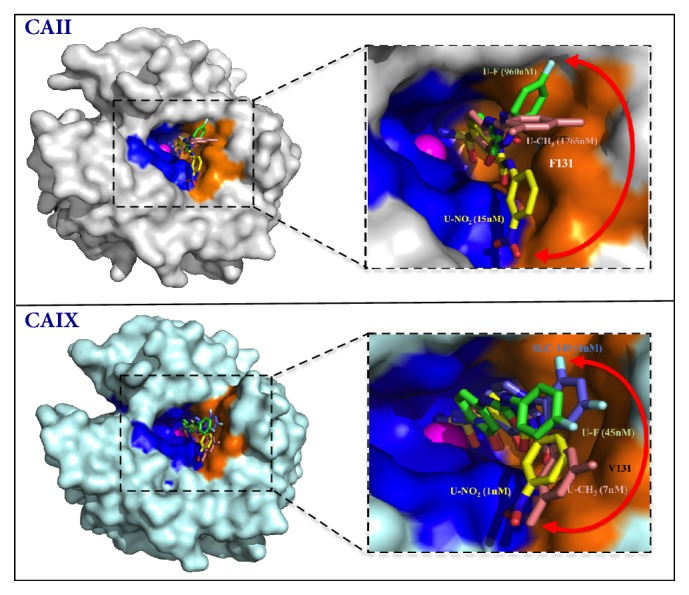
Figure 4.

X-ray crystallography structures showing sulfonamide based inhibitors bound in the active site of CA II (top) and CA IX (bottom). Catalytic zinc (magenta sphere), hydrophilic (blue), and hydrophobic (orange) residues are as shown. Red double-headed arrows indicate isoform specificity relative to residue 131 (labeled in white). These arrows also show flexibility in tail conformations seen in CA II and CA IX. The Ki values of each compound bound to purified CA II and CA IX are also given. Figure was designed using PyMol.
