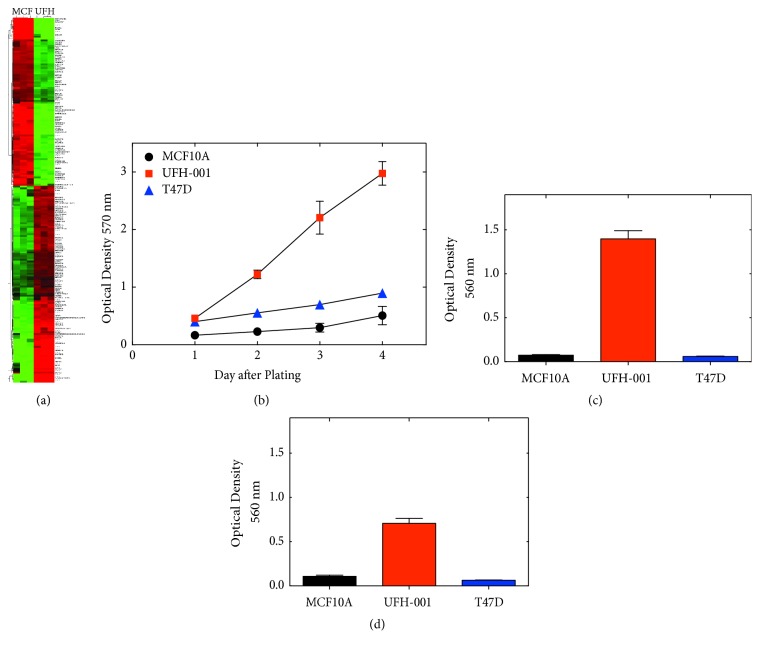
Figure 5.
(a) Heatmap comparing microarray data of differentially expressed genes between UFH-001 (UFH, representative of triple negative breast cancer) and MCF10A (MCF, normal breast cells) cells (top 200 differentially expressed genes are shown). (b) Cell growth curves of MCF10A, UFH-001, and T47D (representative of luminal breast cancer) cells were determined using MTT assays. (c) Migration capacity of cell lines and (d) Invasion capacity of cell lines as determined using transwell Boyden chamber assays.

