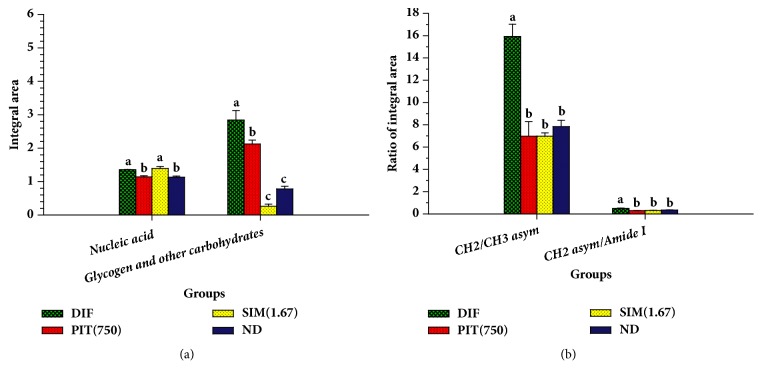
Figure 6.
The histogram of integrated areas of 3T3-L1 cells. DIF = differentiate 3T3-L1 adipocytes (untreated adipocytes); PIT(750) = PIT at 750 μg mL−1 treated adipocytes; SIM(1.67) = Simvastatin at 1.67 μg mL−1 treated adipocytes; ND = 3T3-L1 preadipocytes (nondifferentiated cells). (a) The integral area of nucleic acids, glycogen, and other carbohydrates. (b) The ratio of the integral area of lipids (CH2/CH3 asymmetric stretching) and proteins (CH2 asymmetric stretching/Amide I). Means ± SD are illustrated for three replicates. Means with the same superscript are not significantly different from each other (Tukey's HSD test, p < 0.05).

