
. 2018 Jul 11;2018:1943203. doi: 10.1155/2018/1943203
Copyright © 2018 Shailima Rampogu et al.
This is an open access article distributed under the Creative Commons Attribution License, which permits unrestricted use, distribution, and reproduction in any medium, provided the original work is properly cited.
Figure 10.
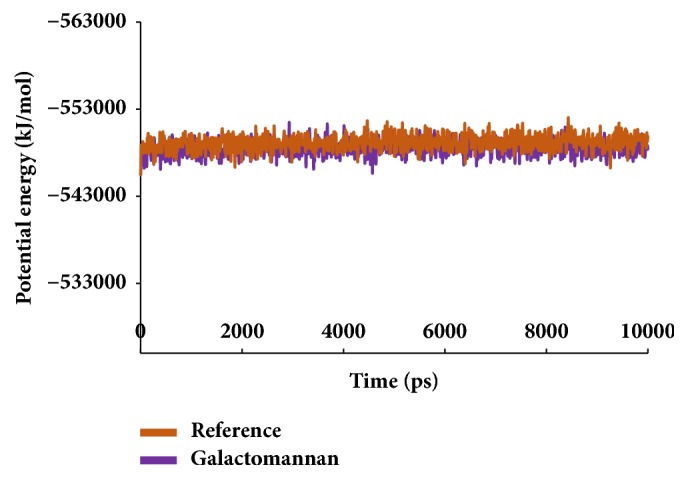
Potential energy graphs of the systems.