Fig. 4:
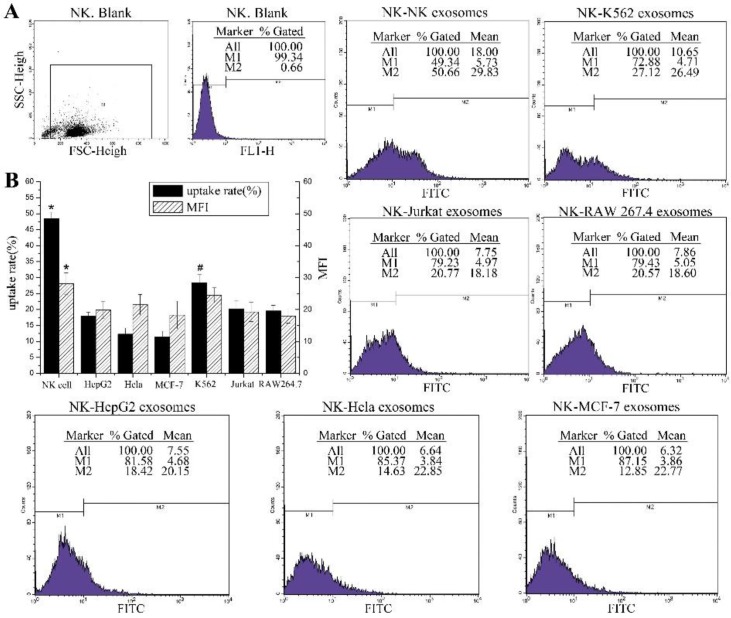
Exosomes uptake efficiencies of NK cells
(A): Flow cytometric analysis of exosomes uptake efficiencies of NK cells; NK cells were co-cultured with the PKH67 labeled exosomes derived from each cell (NK cells, K562 cells, Jurkat cells, RAW 264.7 cells, HepG2 cells, HeLa cells and MCF-7 cells respectively) for 24h and analyzed by flow cytometry. (B): The uptake rates and MFI of each group are summarized in the bar graph. Each column represents the mean ± SD from four independent experiments. One-way ANOVA and LSD test, *: p value of NK group was less than 0.05 compared with the other groups (n = 4). #: p value of K562 group was less than 0.05 compared with the other groups (n = 4).

