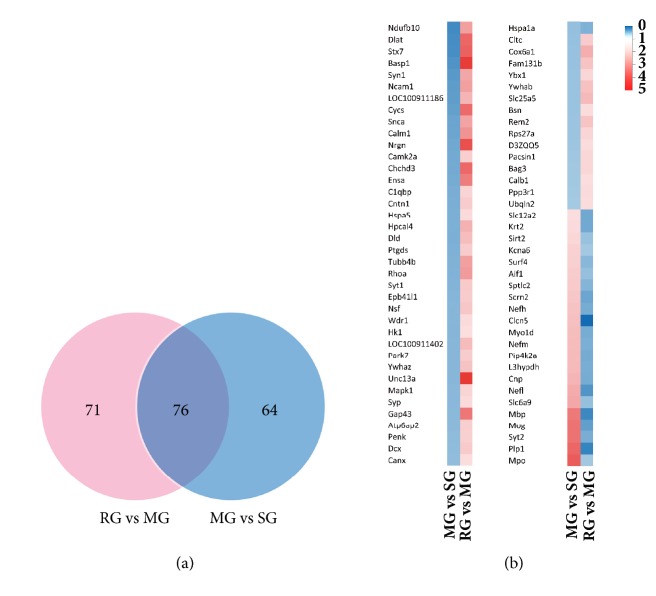
Figure 2.
The number of differentially expressed proteins (DEPs) and their overlap was exhibited in Venn diagram (a). 76 proteins with upregulated and downregulated expressions between MG versus SG and RG versus MG was showed in our study (b). Significant changes in the protein ratios were changed at least 1.5-fold.

