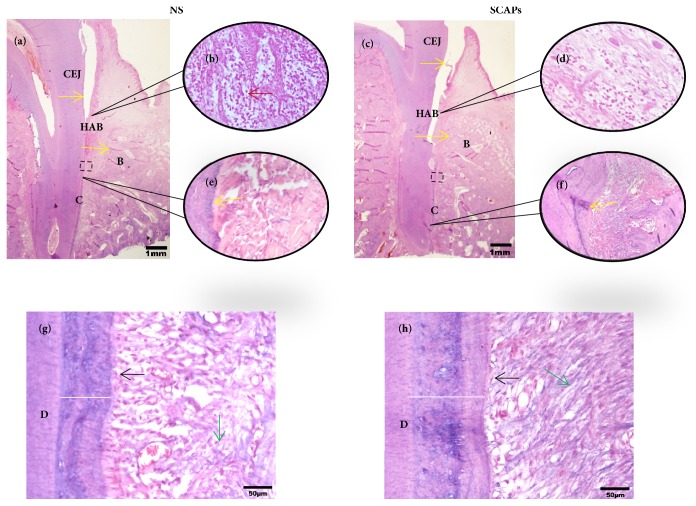
Figure 4.
Whole view of histopathologic assessment for periodontal tissue regeneration by HE. HE staining showing new periodontal tissue regeneration in the periodontal defect area in 0.9% NaCl group (a, b, e, and g) and SCAPs group (c, d, f, and h). (b) Enlarged view of sulcular epithelium of 0.9% NaCl group; (d) enlarged view of sulcular epithelium of SCAPs group; (e) and (f) enlarged view shows notch-shaped marks (yellow arrow) made in 0.9% NaCl group and SCAPs group. (g, h) Enlarged view of periodontal tissues in 0.9% NaCl group and SCAPs group (black rectangular area in a and b). Red arrow, inflammatory cells; green arrow, Sharpey's fibers; black arrow, cementoblast; white bar, the width of new cementum. Bar: =1mm (a, b), 100 μm (e, f), and 50μm (g, h). D, dentin; C, cementum; B, bone; CEJ, cemento-enamel junction; HAB, height of alveolar bone.

