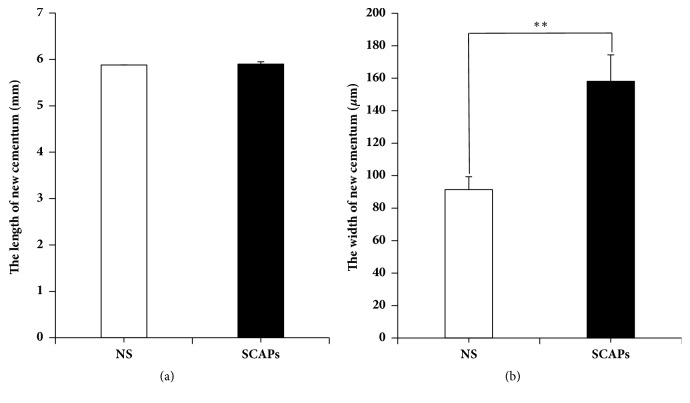
Figure 5.
Quantitative analysis of new cementum showed more regeneration of new cementum in SCAPs group. (a, b) Quantitative analysis of HE staining showing new cementum regenerated in SCAPs group compared with 0.9% NaCl group. Student's t-test was performed to determine statistical significance. Error bars represent SD (n = 6). ∗∗p ≤ 0.01.

