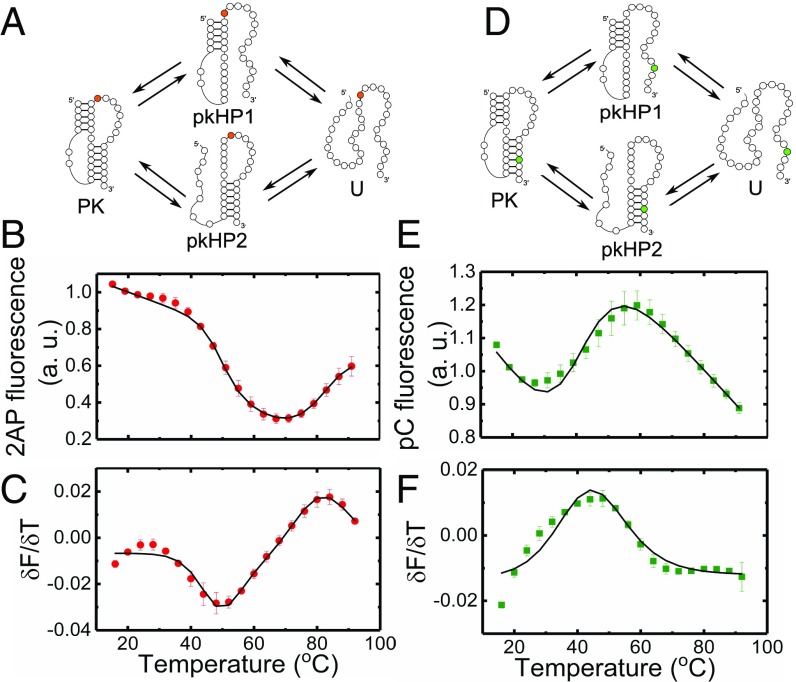
Fig. 3.
Thermodynamics of VPK melting from fluorescence experiments. Folding/unfolding schemes for VPK-2AP (A) and VPK-pC (D) are shown. The 2AP fluorescence of VPK-2AP (B) and pC fluorescence of VPK-pC (E) are plotted as a function of temperature. Measurements were done in 10 mM 3-(N-morpholino)propanesulfonic acid buffer (pH 7.0) at 50 mM KCl. The corresponding first derivatives of the fluorescence with respect to temperature () are plotted as a function of temperature for VPK-2AP (C) and VPK-pC (F). The data (● and ■) are the averages of two to three independent sets of measurements. The errors are the SEM; error bars not visible are smaller than the symbols. For clarity, only every other data point is presented. The continuous lines are fits to a three-state model.

