Fig. 4.
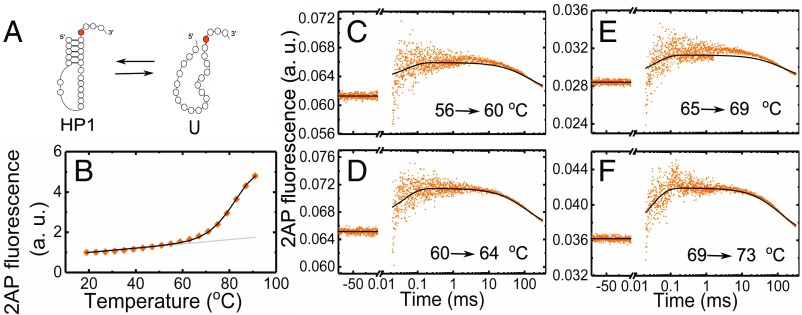
Global analysis of thermodynamics and kinetics measurements on HP1-2AP. (A) Minimal two-state folding/unfolding scheme for HP1-2AP: the fully folded hairpin state (HP1) and the fully unfolded state (U). (B) Fluorescence melting profile of HP1-2AP. The data (♦) are the averages of two independent sets of measurements. The errors are the SEM; error bars not visible are smaller than the symbols. For clarity, only every other data point is presented. The continuous black line is from a global fit of the equilibrium and kinetics data to a two-state kinetic model, as described in SI Appendix, SI Methods 1.9; the gray line represents the temperature dependence of 2AP fluorescence in the hairpin state, as obtained from this global fit. (C–F) Relaxation traces from T-jump measurements on HP1-2AP are shown for four different sets of initial and final temperatures, with an average T-jump 4.2 ± 0.8 °C. Each trace shows the fluorescence intensity level at the initial temperature before the arrival of the IR pulse (denoted by negative times on the x axis); a sharp increase in fluorescence immediately after the IR pulse that heats the sample, reflecting an increase in 2AP fluorescence, possibly from rapid unstacking, followed by relaxation kinetics in a time window of ∼30 μs to ∼1 ms; and then the decay of the temperature of the sample back to the initial temperature on time scales >10 ms. The continuous black lines in each of the panels are from the global fit of the equilibrium and kinetics data.

