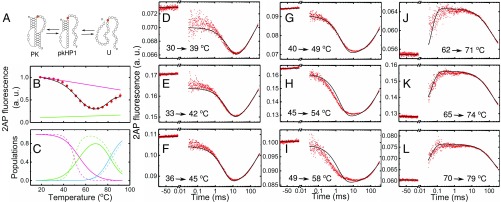
Fig. 5.
Global analysis of thermodynamics and kinetics measurements on VPK-2AP. (A) Three-state folding/unfolding scheme for VPK-2AP: the fully folded PK, a partially folded hairpin state with stem 1 formed but not stem 2 (pkHP1), and unfolded RNA (U). VPK-2AP fluorescence equilibrium and kinetics data were simultaneously fitted using this model. (B) Fluorescence melting profile of VPK-2AP; the data (●) are the averages of two independent sets of measurements. The error bars represent the SEM; error bars not visible are smaller than the symbols. For clarity, only every other data point is presented. The continuous black line is from a global fit of the equilibrium and kinetics data to a three-state kinetic model, as described in the main text; the pink (green) line represents the temperature dependence of 2AP fluorescence in the PK (pkHP1) state, as obtained from this global fit. (C) Equilibrium populations of the three states indicated in A are plotted as a function of temperature: PK (pink), pkHP1 (green), U (blue). The populations are calculated from either the parameters from the global kinetic modeling (continuous lines) or the analysis of the equilibrium data alone (dashed lines; SI Appendix, Table S1). (D–L) Relaxation traces from T-jump measurements on VPK-2AP are shown for nine different sets of initial and final temperatures, with an average T-jump 9.1 ± 3.5 °C. The continuous black lines are from a global fit of the equilibrium and kinetics data.

