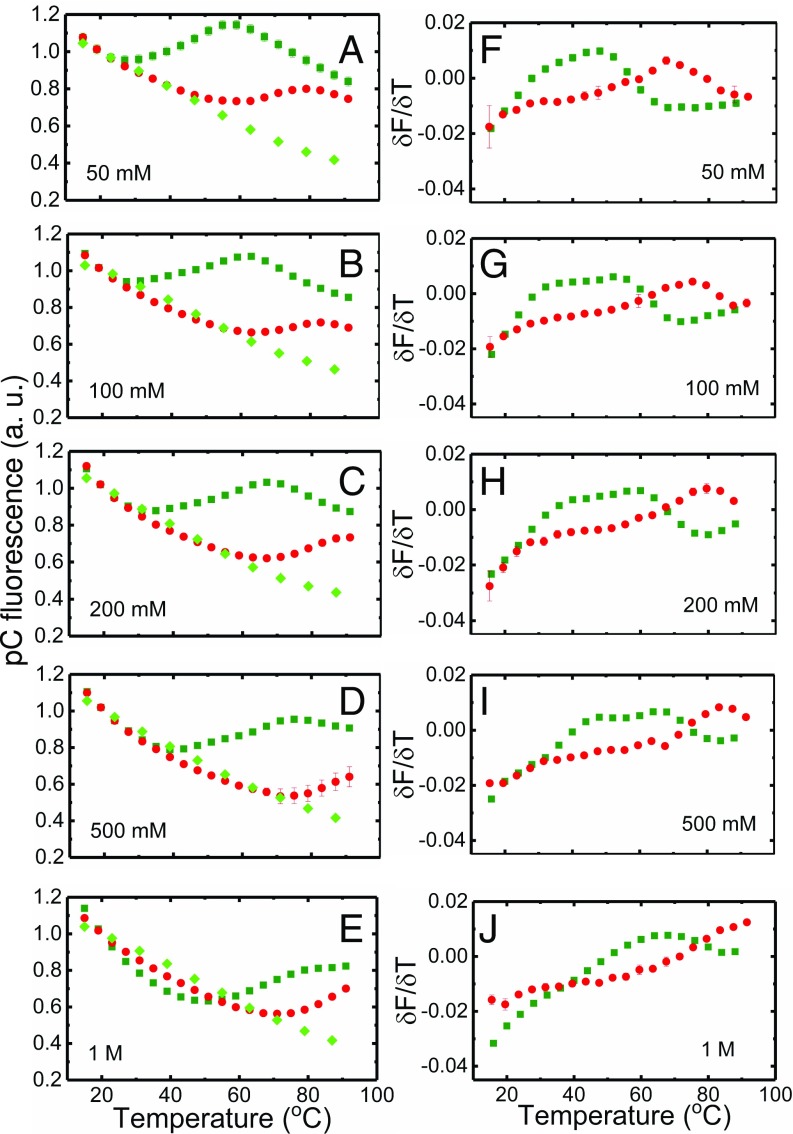
Fig. 6.
Salt dependence of VPK-pC melting profiles. (A–E) Fluorescence melting profiles of VPK-pC (dark green) and HP2-pC (red) are shown at different monovalent salt concentrations; corresponding measurements on reference sample pC-ref are also shown (light green). All data are normalized to match at 20 °C. (F–J) Corresponding first derivatives δ obtained from the melting profiles are plotted as a function of temperature. The data (■, ●, and ♦) are the averages of two independent sets of measurements; the errors are the SEM; error bars not visible are smaller than the symbols.

