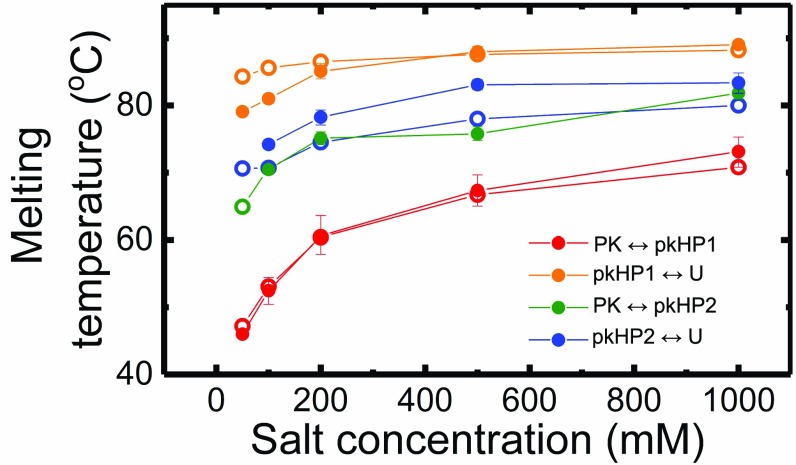
Fig. 8.
Transition temperatures for the four-state parallel pathway model for VPK PK. The transition (or melting) temperatures for the PK-to-hairpin state and hairpin-to-unfolded state for each of the two pathways are plotted as a function of salt, as obtained from simulations (○) and experiments (●). The experimental values are the average of the s obtained from four sets of fits to the VPK-pC fluorescence melting profiles, as also shown in Fig. 7. The error bars represent the compounded uncertainties in the parameters from all four sets of fits, computed as described in SI Appendix, Table S7. Note that the transition temperature for is undetermined from experiments at 50 mM salt.

