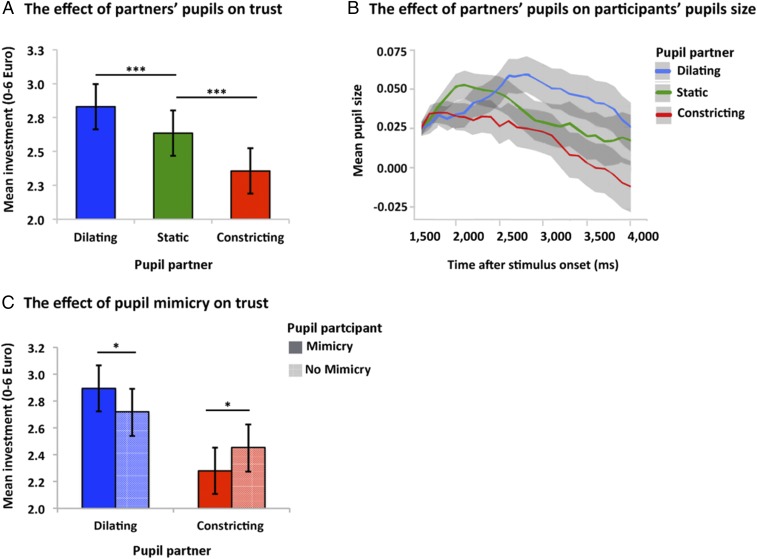
Fig. 2.
Behavioral and pupillometry results. (A) The bar plot shows that mean trust-related investments (€) increased in response to partners’ dilating pupil size (n = 40 participants). Error bars indicate ±1 SE. ***P < 0.001 for each factor, pairwise contrasts: dilating pupils vs. static pupils [B = 0.19, CI (0.08, 0.30)] and constricting pupils vs. static pupils [B = −0.28, CI (−0.38, −0.17)]. (B) Participants mimicked partner’s pupil sizes: the curves correspond to participants’ mean pupil response from baseline over the remaining of stimulus presentation time (ms), in response to partner’s dilating, static, and constricting pupils. Mean pupil size is depicted in arbitrary values. Shaded areas indicate the 99% CI. (C) The bar plot shows mean investments (€) as a function of partners’ and participants’ pupil size. Error bars indicate ±1 SE. *P < 0.01. Mean investment increases when a participant’s own pupils dilate in response to their partner’s dilating pupils. Pairwise contrast: pupil-dilation mimicry vs. no pupil-dilation mimicry [B = 0.175, CI (0.02, 0.33)]. Mean investment decreases when participants’ pupil constricts in response to their partners’ constricting pupils. Pairwise contrast: pupil-constriction mimicry vs. no pupil-constriction mimicry [B = −0.173, CI (−0.33, −0.02)].

