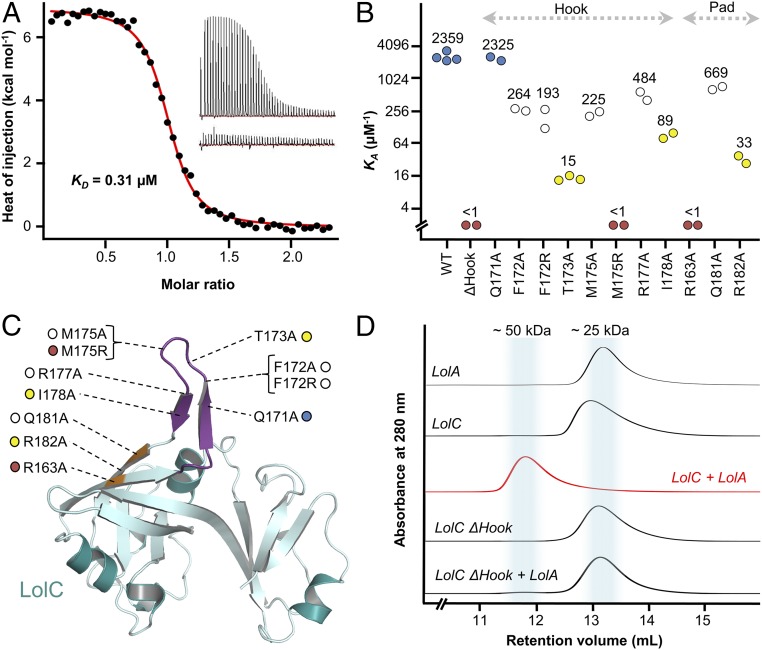
Fig. 3.
ITC and SEC experiments probing the LolA–LolC interface. (A) Representative ITC experiment demonstrating interaction between LolA and LolC. The main figure shows background-corrected heats of injection and a fitted binding curve (red). (Inset) The two thermograms underpinning this curve are shown; injection of LolC into a cell containing LolA (Upper) and injection of LolC into buffer (Lower). (B) Association constants (KA) for wild-type and variant LolC periplasmic domains with LolA determined using ITC. Median values (μM−1) are indicated above each cluster of repeat experiments. Coloring is used to categorize binding strength of variants: wild-type–like binding, blue; modestly impaired, white; strongly impaired, yellow; and nonbinders, red. (C) Locations of amino acid substitutions in context of the LolC periplasmic domain (Hook, purple; Pad, orange). (D) SEC profiles for indicated proteins.

