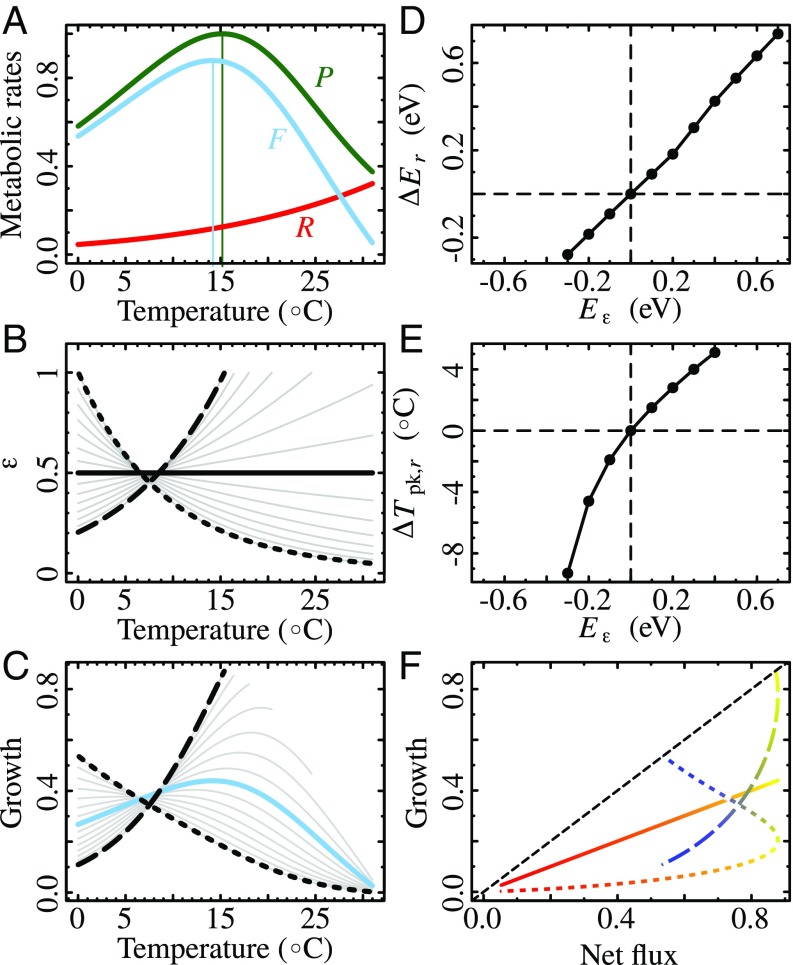
Fig. 1.
The impact of a temperature-dependent allocation efficiency on the TPC of growth rates in a population of photosynthetic cells. (A) Real TPCs for photosynthesis , respiration , and resulting net flux for Cladophora glomerata (a green alga). (B) Allocation efficiency expressed as a Boltzmann–Arrhenius function (Eq. 4 and SI Appendix, section S1.2) with a range of different temperature dependences (set by the activation energy ). (C) The result is a range of different potential growth TPCs. (D and E) (Eq. 5) (D) and (Eq. 6) (E) as functions of the temperature dependence of . (F) Relationships between potential growth and net flux (blues represent colder and reds warmer temperatures). A temperature-dependent affects the shape of the growth TPC and as a result how growth responds to temperature. The growth–net flux relationship can be highly nonlinear in this scenario, with the direction of the nonlinearity (blue-to-red trajectory) depending upon whether increases or decreases with (B). Temperature-independent (solid black line in B) produces growth TPCs that are qualitatively equal to those of net flux (solid blue line in C) and that are unaffected by . In B, C, and F the dotted lines are for and the dashed lines are for . Note that in D and E, larger values of produce curves that do not peak within the experimental temperature range (C).

