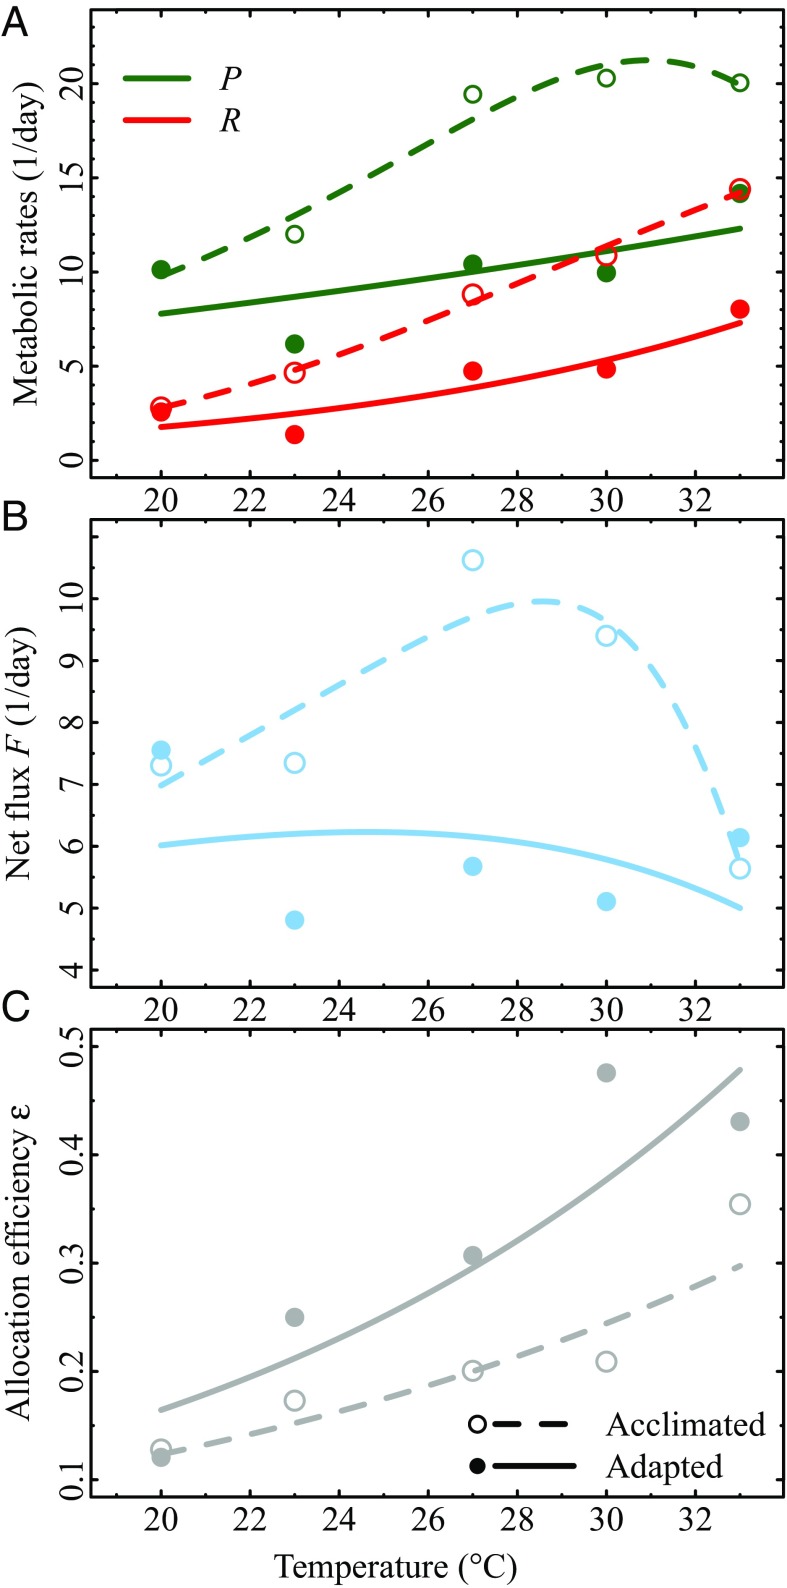
Fig. 2.
Metabolic rates and allocation efficiencies for experiments on acclimated and adapted C. vulgaris populations. (A) Net photosynthesis and dark respiration rates . (B) Net flux . (C) BA (with of 0.53 eV and 0.64 eV for acclimated and adapted populations, respectively; SI Appendix, Table S2). Dashed lines and open circles are for acclimated responses (10 generations) and solid lines and solid circles are for adapted responses (100 generations). Circles correspond to the means of three replicate experimental values at each growth temperature.

