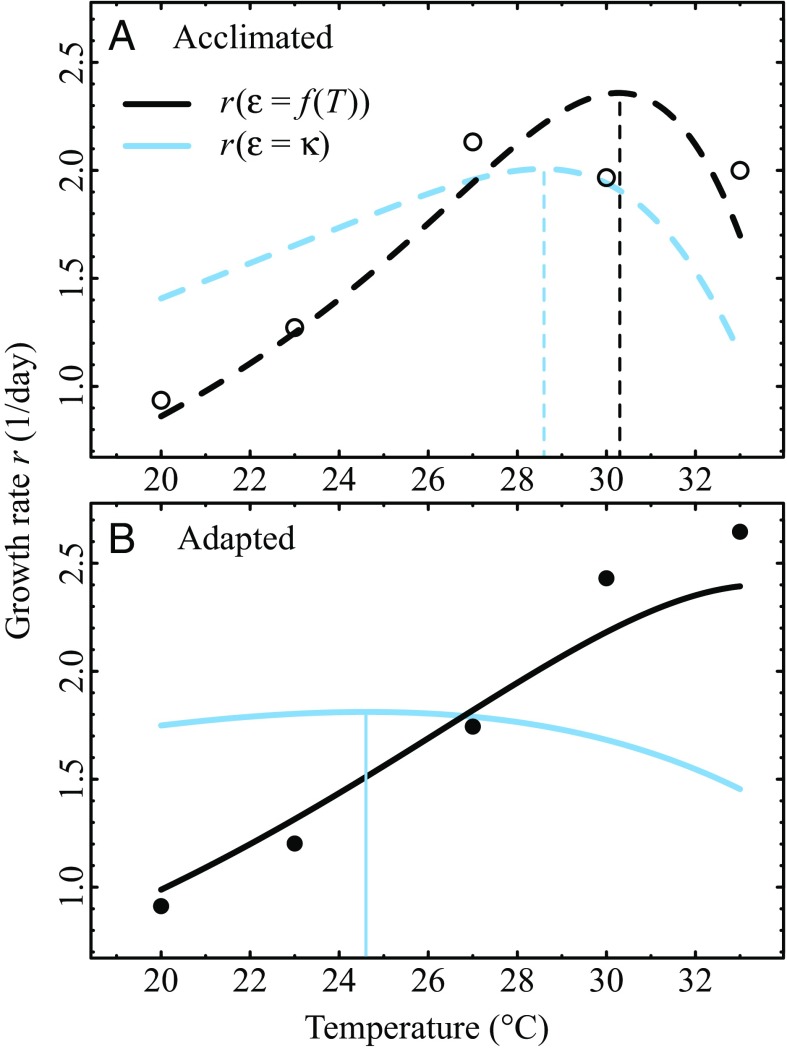
Fig. 3.
Growth rates with temperature-independent and -dependent , for experiments on acclimated and adapted C. vulgaris populations. (A and B) Growth rates for (A) acclimated and (B) adapted populations. Light blue lines are for growth assuming a temperature-independent , while black lines are for growth with the of Fig. 2C. Vertical lines correspond to the respective values. (Eq. 5) was 0.53 eV and 0.64 eV for acclimated and adapted populations, respectively, corresponding to the values of (Fig. 2C) and thus in line with theoretical expectations. (Eq. 6) was C and over C for acclimated and adapted populations, respectively. Circles correspond to the means of three replicate experimental values at each growth temperature.

