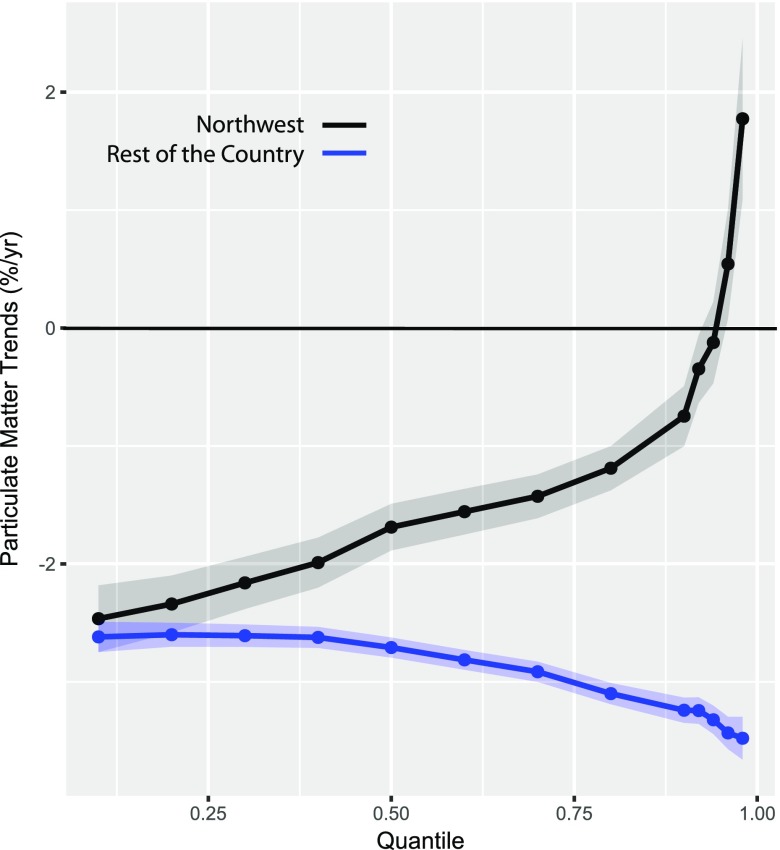
Fig. 4.
Quantile regression trends. The black and blue dotted lines indicate the trend in PM2.5 across quantiles from 0.10 (10th) to 0.98 (98th) for the Northwest United States (n = 23) and the rest of the country (n = 89), respectively. Shading indicates the 95% CI from the average trend. From 0.10 to 0.90, intervals of 0.10 are chosen, and from quantile 0.90–0.98, intervals of 0.02 are chosen.

