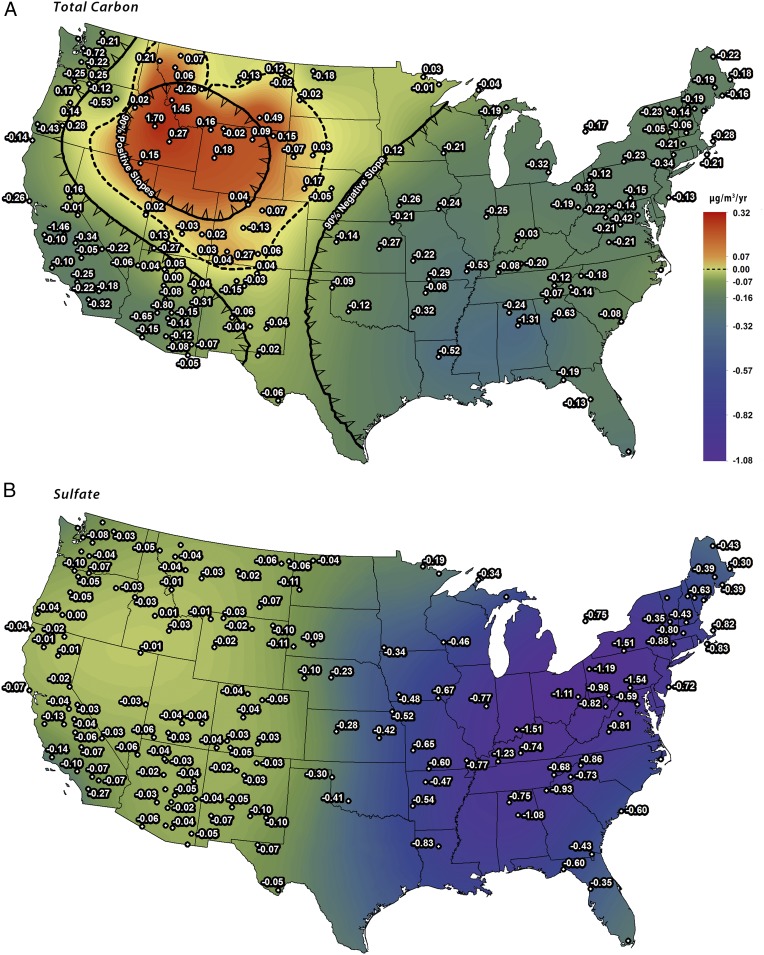
Fig. 5.
TC and SO4 98th quantile trends. Observed 98th quantile TC (Top) and SO4 (Bottom) trends (calculated using QR methods) from IMPROVE sites for 1988–2016 are shown by black dots with corresponding values in µg·m−3·y−1. Krige-interpolated values (calculated from observed data) are shown by the color ramp. In A, the solid black lines with arrows (indicating direction) show the boundary where 90% of the Krige-interpolated TC trends within are positive or negative. Of the 149 sites, 73 show statistical significance. In B, all regions are within the 90% negative slope estimation. Of the 156 sites, 145 show statistical significance.

