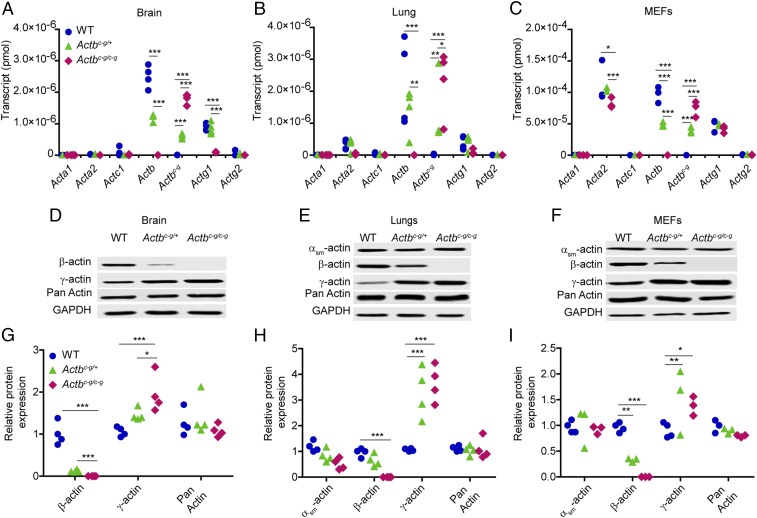
Fig. 1.
Actbc-g transcript is synthesized from the edited Actb locus and correlates with a twofold increase in γ-actin protein expression. (A–C) Calculated quantity of isoactin transcript via qRT-PCRs in brain (n = 4 mice), lung tissues (n = 4 mice), and MEFs (n = 3 embryos). The x axis denotes actin isoform; the y axis denotes transcript in pmol. (D–F) Representative Western blots in brain, lung, and MEFs. (G–I) Calculated relative isoactin protein expression in WT, heterozygous, and homozygous Actbc-g mice brain (n = 4 mice), lung (n = 4 mice), and MEFs (n ≥ 3 embryos). The x axis denotes actin isoform; the y axis denotes relative protein expression which was normalized to GAPDH and relative to a WT sample. Two-way ANOVA with Bonferroni posttest was performed. *P < 0.05, **P < 0.01, ***P < 0.001.

