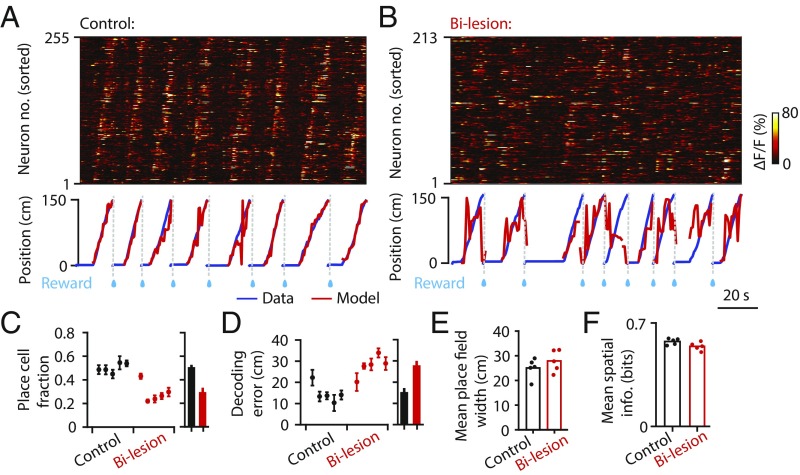
Fig. 3.
Bilateral hippocampal lesions severely impair place cell activity in RSC. (A) (Top) Raw calcium time courses of 255 simultaneously imaged RSC neurons from an example control mouse. Neurons were sorted by the positions that elicited their maximum responses. (Bottom) Real (blue) and Bayesian decoded (red) position traces. (B) The same as A but from an example bilateral lesion mouse. (C) (Left) Mean place cell fractions of individual mice in the control and bilesion groups (all Thy1 mice). Error bars are SEM over sessions. (Right) Bar plots of the average place cell fractions for the two groups. Error bars are SEM over animals. (D) The same as C but for decoding errors. (E) Bar plot of the mean place field width. Colored dots correspond to the mean place field width of individual mice in the control and bilesion groups. (F) The same as E but for the mean spatial information of identified place cells in each animal.

