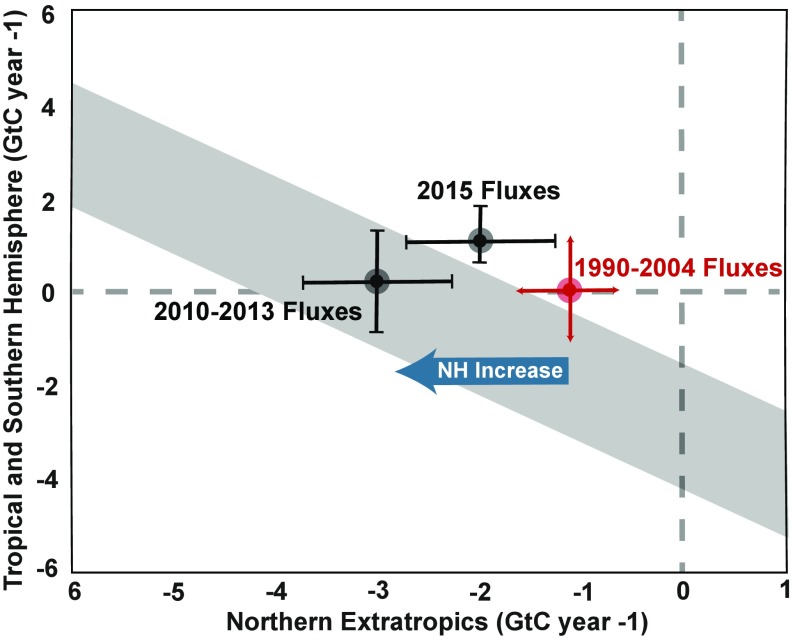
Fig. 3.
Decadal increases in northern extratropical uptake and anomalous fluxes during the El Niño year of 2015. Shown is partitioning of the average and 2015 El Niño land sink between the northern extratropics and Southern Hemisphere (SH), 1990–2015. The sum of the northern extratropical and Southern Hemisphere and tropical, SH axis values equals the total land sink and can be compared with the residual land sink from the global budget (indicated by the diagonal band) calculated by the Global Carbon Project, in this case averaged for the years 2010–2016. Any combination of SH and Northern Hemisphere (NH) within the band (± uncertainty, the width of the band) satisfies the global carbon budget constraint. The constraint for the period 1990–2007 was quite different and is not the same as the 2010–2016 band. The average fluxes for the period 1990–2004 are from Schimel et al. (29). The blue arrow indicates the apparent large decadal increase in NH extratropical uptake from the earlier period to the present. The 2010–2013 results are from the Carbon Monitoring System-Flux system (49).

