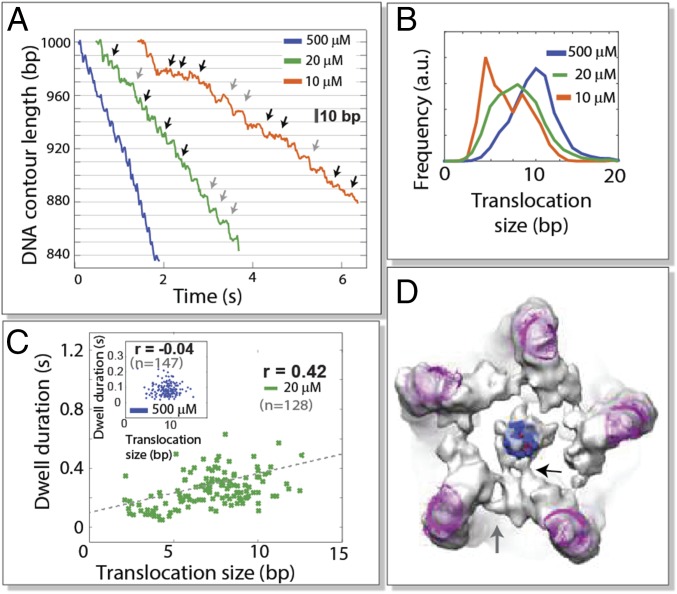
Fig. 2.
Behavior of WT motors at very low [ATP]. (A) Sample packaging trajectories of WT motors at different [ATP]. Gray arrows indicate 10-bp translocation events. Black arrows indicate translocation events smaller than 10 bp in size. (B) Translocation size distribution at saturating and sub-Km ATP conditions. (C) Correlation between dwell duration and the following translocation size at low [ATP] (green dots) and at saturating [ATP] (Inset; blue dots); r is the Pearson correlation coefficient. (D) Asymmetric cryo-EM reconstruction. Electron density of viral particles stalled during DNA packaging with ATPγS. ATPase subunits and DNA viewed in a bottom view (from the outside) of the bacteriophage. Atomic-resolution structures of packaging RNA (magenta) and DNA (dark blue) were fitted to the electron density. The black arrow indicates more extensive contacts between one of the subunits and the DNA. The gray arrow indicates the more extensive contacts established by two adjacent subunits.

