Fig. 2.
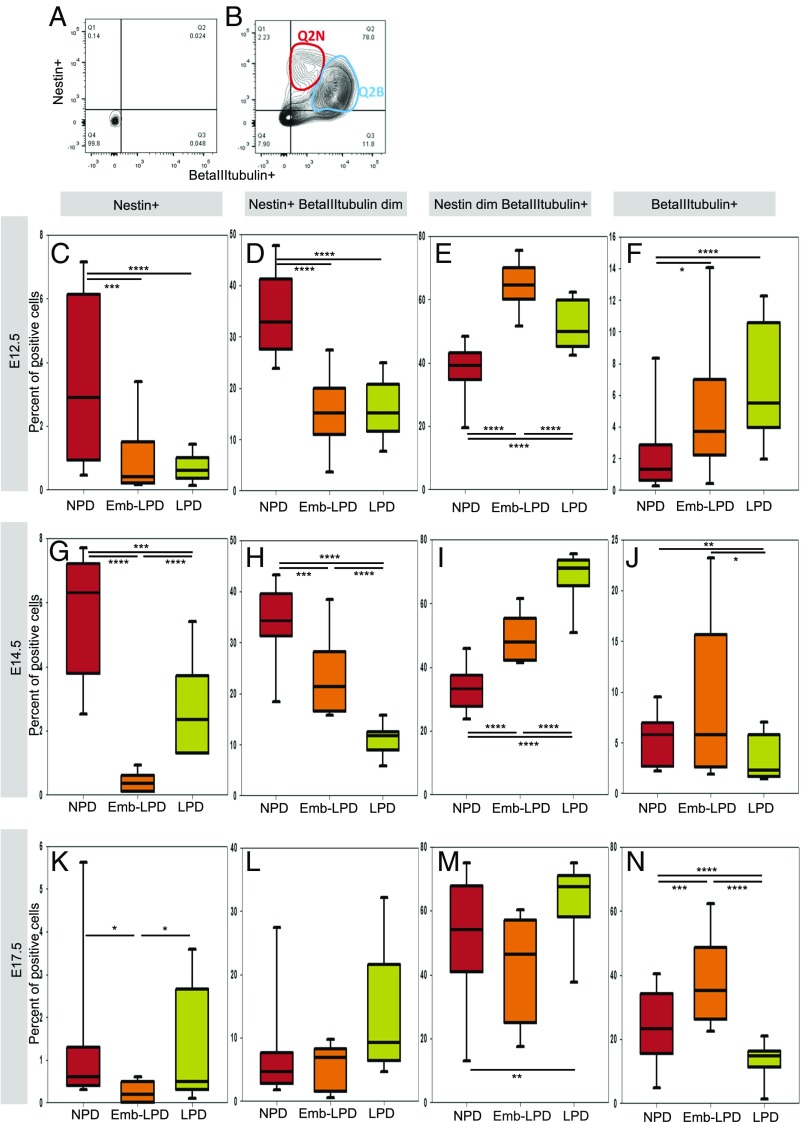
Maternal diet affects expression of neural stem cells and neuronal differentiation markers analyzed by flow cytometry in ganglionic eminences cells. Example of FACS plots with isotype control antibodies (A) and antibodies against Nestin and beta-III-tubulin (B), showing how ganglionic eminences cells were defined and gated: Nestin-only positive cells (Q1), double-positive cells (Q2), and beta-III-tubulin–only positive cells (Q4). Double-positive cells (Q2) were further separated into Nestin+ beta-III-tubulin dim (Q2N) and Nestin dim beta-III-tubulin+ (Q2B). A total of 10,000 cells were analyzed per sample. (C–K) Quantification by flow cytometry of E12.5 (C–F), E14.5 (G–J), and E17.5 (K–N) ganglionic eminences cells stained for Nestin and beta-III-tubulin. Nestin-only positive cells (C, G, and K), double-positive cells separated into Nestin+ beta-III-tubulin dim (D, H, and L) and Nestin dim beta-III-tubulin+ (E, I, and M), and beta-III-tubulin–only positive cells (F, J, and N) were quantified. E12.5 ganglionic eminences data represent n = 24 (NPD), 18 (Emb-LPD), and 21 (LPD) fetuses from eight (NPD), six (Emb-LPD), and seven (LPD) mothers. E14.5 ganglionic eminences data represent n = 131 (NPD), 125 (Emb-LPD), and 124 (LPD) fetuses from 17 (NPD), 17 (Emb-LPD), and 18 (LPD) mothers. E17.5 ganglionic eminences data represent n = 18 (NPD), 18 (Emb-LPD), and 18 (LPD) fetuses from six (NPD), six (Emb-LPD), and six (LPD) mothers. Boxes represent interquartile ranges, with middle lines representing the medians; whiskers (error bars) above and below the box indicate the 90th and 10th percentiles, respectively. *P < 0.05, **P < 0.01, ***P < 0.001, ****P < 0.0001.

