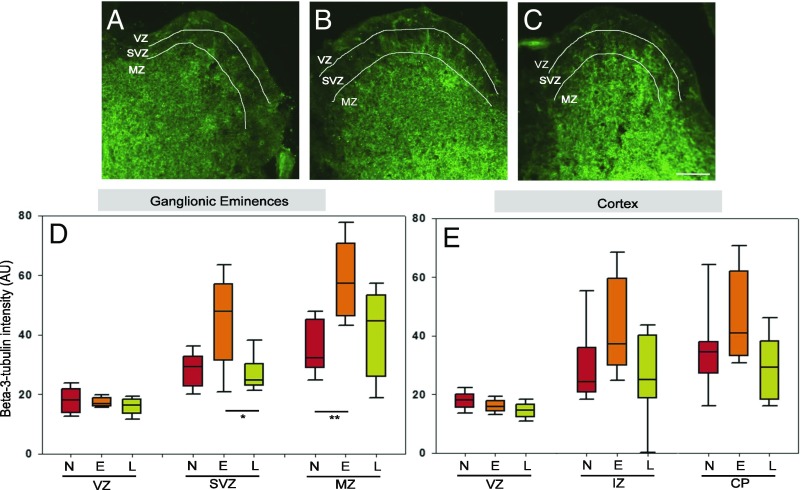
Fig. 4.
Maternal diet affects expression of neuronal differentiation markers analyzed by immunohistochemistry in E14.5 ganglionic eminences and cortex. (A–C) Representative images illustrate the staining results quantified: beta-III-tubulin (green) stained on E14.5 ganglionic eminences sections from maternal NPD (A), Emb-LPD (B), and LPD (C). (Scale bar, 150 µm.) (D and E) Quantification of beta-III-tubulin staining (percentage of positive pixels per area) on E14.5 ganglionic eminences (D) and cortex (E) sections from different maternal diets. Data represent three quantifications per layer per section of three sections per brain, from nine fetal brains from nine different mothers per diet. Boxes represent interquartile ranges, with middle lines representing the medians; whiskers (error bars) above and below the box indicate the 90th and 10th percentiles, respectively. *P < 0.05, **P < 0.01, ***P < 0.001, ****P < 0.0001. E, Emb-LPD; L, LPD; N, NPD.

