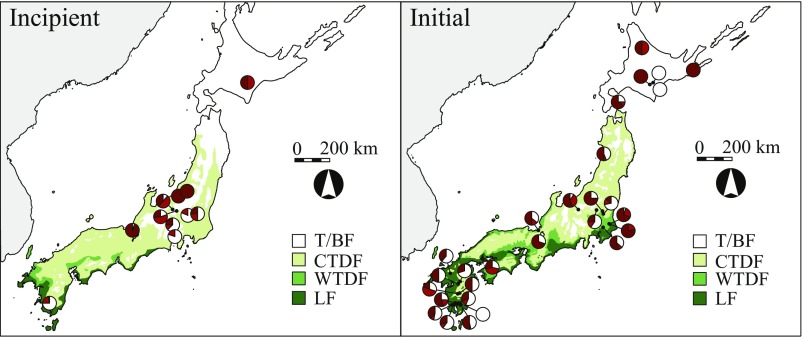
Fig. 1.
Locations of the sampling sites, distributions of the aquatic biomarkers/phytanic acid SRR ratios (from Table 1), and change in vegetation cover (9, 10) across the Japanese archipelago from the Late Pleistocene/Incipient Jōmon (Left) to Early Holocene/Initial Jōmon (Right). The maps account for changes in sea level across these periods (45). Dark red, complete suite of aquatic biomarkers and/or phytanic acid SRR ratio >75.5%; red, partial suite of aquatic biomarkers; open, absence of aquatic biomarkers and/or phytanic acid SRR ratio <75.5%. CTDF, cool temperature deciduous forest; LF, lucidophyllous forest; T/BF, tundra/boreal forest; WTDF, warm temperature deciduous forest.

