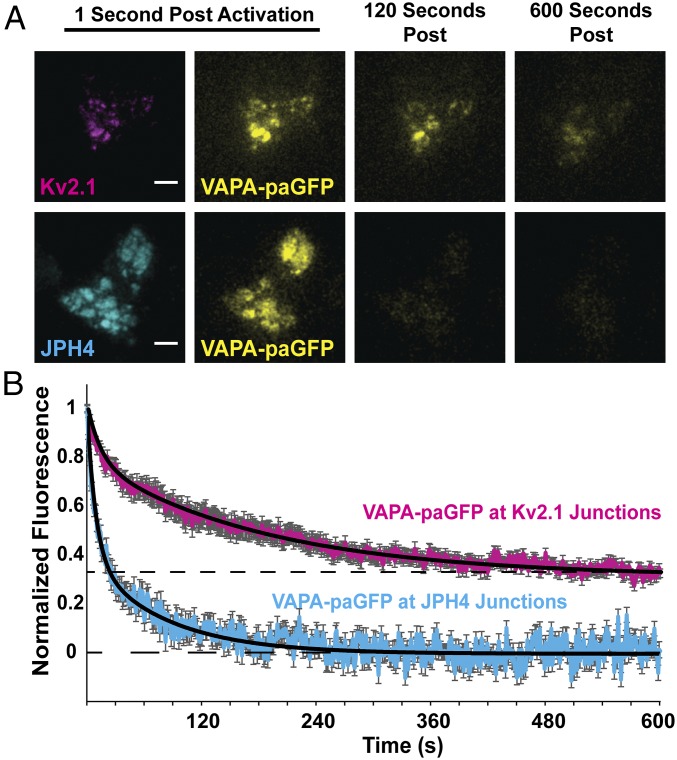
Fig. 5.
Photoactivatable-GFP (paGFP)-based analysis of VAPA stability at Kv2.1-induced ER/PM junctions. (A) Representative TIRF microscopy images of VAPA-paGFP at either Kv2.1- or JPH4-induced ER/PM junctions 1 s, 120 s, and 600 s after 405-nm induced photoactivation in TIRF. (Scale bars: 5 µm.) (B) Time course of paGFP-fluorescence loss. Normalized fluorescence measurements were fitted with a two-exponential decay, black lines (). VAPA was significantly less stable at JPH4-induced ER/PM junctions (τ1 = 9.1, τ2 = 80.5) than at Kv2.1 junctions (τ1 = 13.9, τ2 = 186.3), P = 0.0395 at 600 s. Error bars represent SEM. Twenty-five ROIs from 5 Kv2.1-expressing cells and 20 ROIs from 20 JPH4-expressing cells were used.

